I've seen all these studies that show how a 100ms improvement in page load time has a significant effect on page views, conversion rate, etc., but I'd never actually tried to optimize my site. This blog is a static Octopress site, hosted on GitHub Pages. Static sites are supposed to be fast, and GitHub Pages uses Fastly, which is supposed to be fast, so everything should be fast, right?
Not having done this before, I didn't know what to do. But in a great talk on how the internet works, Dan Espeset suggested trying webpagetest; let's give it a shot.
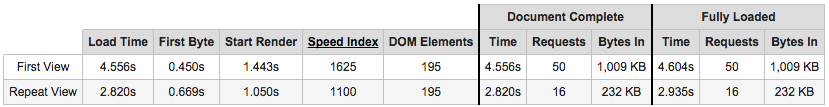
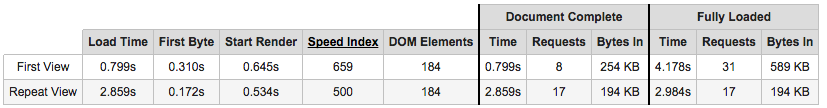
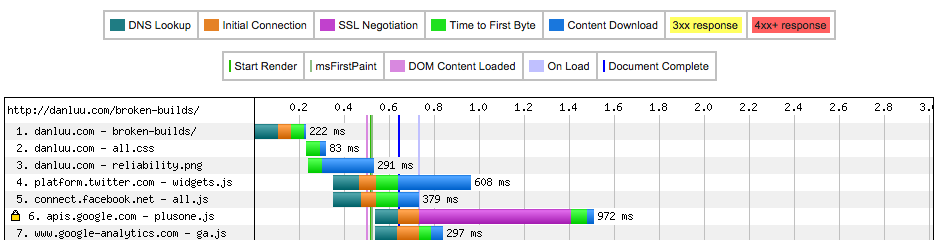
Here's what it shows with my nearly stock Octopress setup. The only changes I'd made were enabling Google Analytics, the social media buttons at the bottom of posts, and adding CSS styling for tables (which are, by default, unstyled and unreadable).
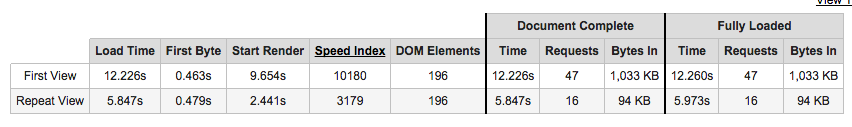
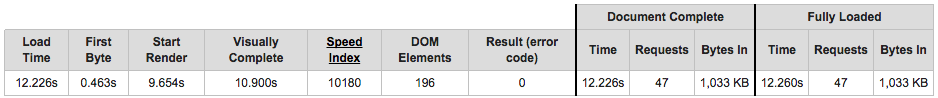
12 seconds to the first page view! What happened? I thought static sites were supposed to be fast. The first byte gets there in less than half a second, but the page doesn't start rendering until 9 seconds later.
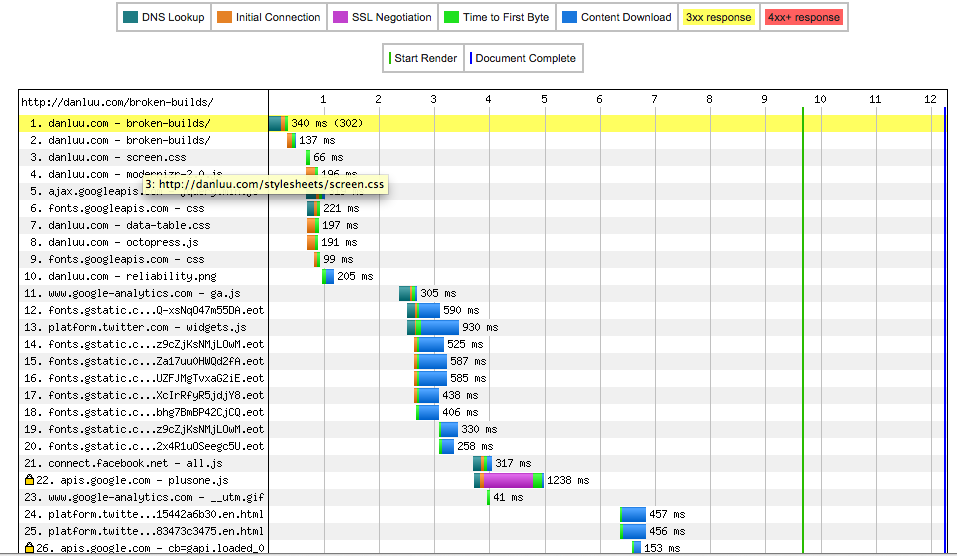
Looks like the first thing that happens is that we load a bunch of js and CSS. Looking at the source, we have all this js in source/_includes/head.html.
<script src="{{ root_url }}/javascripts/modernizr-2.0.js"></script>
<script src="//ajax.googleapis.com/ajax/libs/jquery/1.9.1/jquery.min.js"></script>
<script>!window.jQuery && document.write(unescape('%3Cscript src="./javascripts/lib/jquery.min.js"%3E%3C/script%3E'))</script>
<script src="{{ root_url }}/javascripts/octopress.js" type="text/javascript"></script>
{% include google_analytics.html %}
I don't know anything about web page optimization, but Espeset mentioned that js will stall page loading and rendering. What if we move the scripts to source/_includes/custom/after_footer.html?
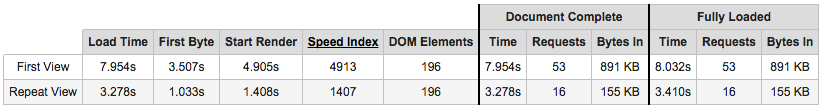
That's a lot better! We've just saved about 4 seconds on load time and on time to start rendering.
Those script tags load modernizer, jquery, octopress.js, and some google analytics stuff. What is in this octopress.js anyway? It's mostly code to support stuff like embedding flash videos, delicious integration, and github repo integration. There are a few things that do get used for my site, but most of that code is dead weight.
Also, why are there multiple js files? Espeset also mentioned that connections are finite resources, and that we'll run out of simultaneous open connections if we have a bunch of different files. Let's strip out all of that unused js and combine the remaining js into a single file.
Much better! But wait a sec. What do I need js for? As far as I can tell, the only thing my site is still using octopress's js for is so that you can push the right sidebar back and forth by clicking on it, and jquery and modernizer are only necessary for the js used in octopress. I never use that, and according to in-page analytics no one else does either. Let's get rid of it.
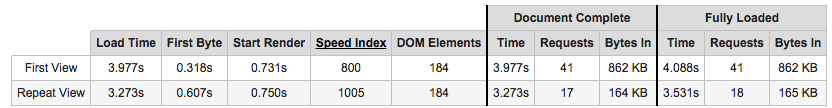
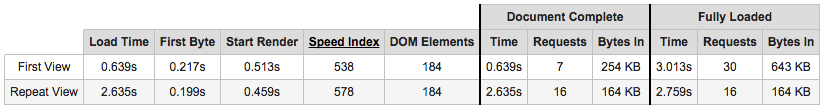
That didn't change total load time much, but the browser started rendering sooner. We're down to having the site visually complete after 1.2s, compared to 9.6s initially -- an 8x improvement.
What's left? There's still some js for the twitter and fb widgets at the bottom of each post, but those all get loaded after things are rendered, so they don't really affect the user's experience, even though they make the “Load Time” number look bad.
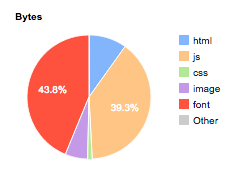
This is a pie chart of how many bytes of my page are devoted to each type of file. Apparently, the plurality of the payload is spent on fonts. Despite my reference post being an unusually image heavy blog post, fonts are 43.8% and images are such a small percentage that webpagetest doesn't even list the number. Doesn't my browser already have some default fonts? Can we just use those?
Turns out, we can. The webpage is now visually complete in 0.9s -- a 12x improvement. The improvement isn't quite as dramatic for “Repeat View” -- it's only an 8.6x improvement there -- but that's still pretty good.
The one remaining “obvious” issue is that the header loads two css files, one of which isn't minified. This uses up two connections and sends more data than necessary. Minifying the other css file and combining them speeds this up even further.
Time to visually complete is now 0.7s -- a 15.6x improvement. And that's on a page that's unusually image heavy for my site.
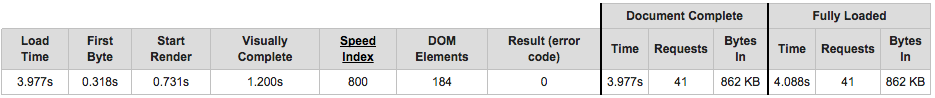
At this point the only things that happen before the page starts displaying are:, loading the HTML, loading the one css file, and loading the giant image (reliability.png).
We've already minified the css, so the main thing left to do is to make giant image better. I already ran optipng -o7 -zm1-9 on all my images, but ImageOptim was able to shave off another 4% of the image, giving a slight improvement. Across all the images in all my posts, ImageOptim was able to reduce images by an additional 20% over optipng, but it didn't help much in this case.
I also tried specifying the size of the image to see if that would let the page render before the image was finished downloading, but it didn't result in much of a difference.
After that, I couldn't think of anything else to try, but webpagetest had some helpful suggestions.

Apparently, the server I'm on is slow (it gets a D in sending the first byte after the initial request). It also recommends caching static content, but when I look at the individual suggestions, they're mostly for widgets I don't host/control. I should use a CDN, but Github Pages doesn't put content on a CDN for bare domains unless you use a DNS alias record, and my DNS provider doesn't support alias records. That's two reasons to stop servering from Github Pages (or perhaps one reason to move off Github Pages and one reason to get another DNS provider), so I switched to Cloudflare, which shaved over 100ms off the time to first byte.
Note that if you use Cloudflare for a static site, you'll want to create a "Page Rule" and enable "Cache Everything". By default, Cloudflare doesn't cache HTML, which is sort of pointless on a static blog that's mostly HTML. If you've done the optimizations here, you'll also want to avoid their "Rocket Loader" thing which attempts to load js asynchronously by loading blocking javascript. "Rocket Loader" is like AMP, in that it can speed up large, bloated, websites, but is big enough that it slows down moderately optimized websites.
Here's what happened after I initally enabled Cloudflare without realizing that I needed to create a "Page Rule".

That's about a day's worth of traffic in 2013. Initially, Cloudflare was serving my CSS and redirecting to Github Pages for the HTML. Then I inlined my CSS and Cloudflare literally did nothing. Overall, Cloudflare served 80MB out of 1GB of traffic because it was only caching images and this blog is relatively light on images.
I haven't talked about inlining CSS, but it's easy and gives a huge speedup on the first visit since it means only one connection is required to display the page, instead of two sequentialy connections. It's a disadvantage on future visits since it means that the CSS has to be re-downloaded for each page, but since most of my traffic is from people running across a single blog post, who don't click through to anything else, it's a net win. In _includes/head.html
<link href="{{ root_url }}/stylesheets/all.css" media="screen, projection" rel="stylesheet" type="text/css">
should change to
{\% include all.css %}
In addition, there's a lot of pointless cruft in the css. Removing the stuff that, as someone who doesn't know CSS can spot as pointless (like support for delicious, support for Firefox 3.5 and below, lines that firefox flags as having syntax errors such as no-wrap instead of nowrap) cuts down the remaining CSS by about half. There's a lot of duplication remaining and I expect that the CSS could be reduced by another factor of 4, but that would require actually knowing CSS. Just doing those things, we get down to .4s before the webpage is visually complete.

That's a 10.9/.4 = 27.5 fold speedup. The effect on mobile is a lot more dramatic; there, it's closer to 50x.
I'm not sure what to think about all this. On the one hand, I'm happy that I was able to get a 25x-50x speedup on my site. On the other hand, I associate speedups of that magnitude with porting plain Ruby code to optimized C++, optimized C++ to a GPU, or GPU to quick-and-dirty exploratory ASIC. How is it possible that someone with zero knowledge of web development can get that kind of speedup by watching one presentation and then futzing around for 25 minutes? I was hoping to maybe find 100ms of slack, but it turns out there's not just 100ms, or even 1000ms, but 10000ms of slack in a Octopress setup. According to a study I've seen, going from 1000ms to 3000ms costs you 20% of your readers and 50% of your click-throughs. I haven't seen a study that looks at going from 400ms to 10900ms because the idea that a website would be that slow is so absurd that people don't even look into the possibility. But many websites are that slow!
Update
I found it too hard to futz around with trimming down the massive CSS file that comes with Octopress, so I removed all of the CSS and then added a few lines to allow for a nav bar. This makes almost no difference on the desktop benchmark above, but it's a noticable improvement for slow connections. The difference is quite dramatic for 56k connections as well as connections with high packetloss.
Starting the day I made this change, my analytics data shows a noticeable improvement in engagement and traffic. There are too many things confounded here to say what caused this change (performance increase, total lack of styling, etc.), but there are a couple of things find interesting about this. First, it seems to likely show that the advice that it's very important to keep line lengths short is incorrect since, if that had a very large impact, it would've overwhelmed the other changes and resulted in reduced engagement and not increased engagement. Second, despite the Octopress design being widely used and lauded (it appears to have been the most widely used blog theme for programmers when I started my blog), it appears to cause a blog (or at least this blog) to get less readership than literally having no styling at all. Having no styling is surely not optimal, but there's something a bit funny about no styling beating the at-the-time most widely used programmer blog styling, which means it likely also beat wordpress, svtble, blogspot, medium, etc., since those have most oof the same ingredients as Octopress.
Resources
Unfortunately, the video of the presentation I'm referring to is restricted RC alums. If you're an RC alum, check this out. Otherwise high-performance browser networking is great, but much longer.
Acknowledgements
Thanks to Leah Hanson, Daniel Espeset, and Hugo Jobling for comments/corrections/discussion.
I'm not a front-end person, so I might be totally off in how I'm looking at these benchmarks. If so, please let me know.