This is a pseudo-transcript (actual words modified to be more readable than a 100% faithful transcription) of a short lightning talk I did at Twitter a year or two ago, on pitfalls of how we use latency metrics (with the actual service names anonymized per a comms request). Since this presentation, significant progress has been made on this on the infra side, so the situation is much improved over what was presented, but I think this is still relevant since, from talking to folks at peer companies, many folks are facing similar issues.
We frequently use tail latency metrics here at Twitter. Most frequently, service owners want to get cluster-wide or Twitter-wide latency numbers for their services. Unfortunately, the numbers that service owners tend to use differ from what we'd like to measure due some historical quirks in our latency measurement setup:
- Opaque, uninstrumented, latency
- Lack of, cluster-wide, aggregation capability
- Minutely resolution
Opaque, uninstrumented, latency
When we look at the dashboards for most services, the latency metrics that are displayed and are used for alerting are usually from the server the service itself is running on. Some services that have dashboards set up by senior SREs who've been burned by invisible latency before will also have the service's client-observed latency from callers of the service. I'd like to discuss three issues with this setup.
For the purposes of this talk, we can view a client request as passing through the following pipeline after client "user" code passes the request to our RPC layer, Finagle(https://twitter.github.io/finagle/), and before client user code receive the response (the way Finagle currently handles requests, we can't get timestamps for a particular request once the request is handled over to the network library we use, netty
client netty -> client Linux -> network -> server Linux -> server netty -> server "user code" -> server netty -> server Linux -> network -> client Linux -> client netty
As we previously saw in [an internal document quantifying the impact of CFS bandwidth control throttling and how our use of excessively large thread pools causes throttling], we frequently get a lot of queuing in and below netty, which has the knock-off effect of causing services to get throttled by the kernel, which often results in a lot of opaque latency, especially when under high load, when we most want dashboards to show correct latency numbers..
When we sample latency at the server, we basically get latency from
- Server service "user" code
When we sample latency at the client, we basically get
- Server service "user" code
- Server-side netty
- Server-side Linux latency
- Client-side Linux latency
- Client-side netty latency
Two issues with this are that we don't, with metrics data, have a nice way to tell if latency is in the opaque parts of the stack are coming from the client or the server. As a service owner, if you set alerts based on client latency, you'll get alerted when client latency rises because there's too much queuing in netty or Linux on the client even when your service is running smoothly.
Also, the client latency metrics that are reasonable to look at given what we expose give you latency for all servers a client talks to, which is a really different view from what we see on server metrics, which gives us per-server latency numbers and there isn't a good way to aggregate per-server client numbers across all clients, so it's difficult to tell, for example, if a particular instance of a server has high latency in netty.
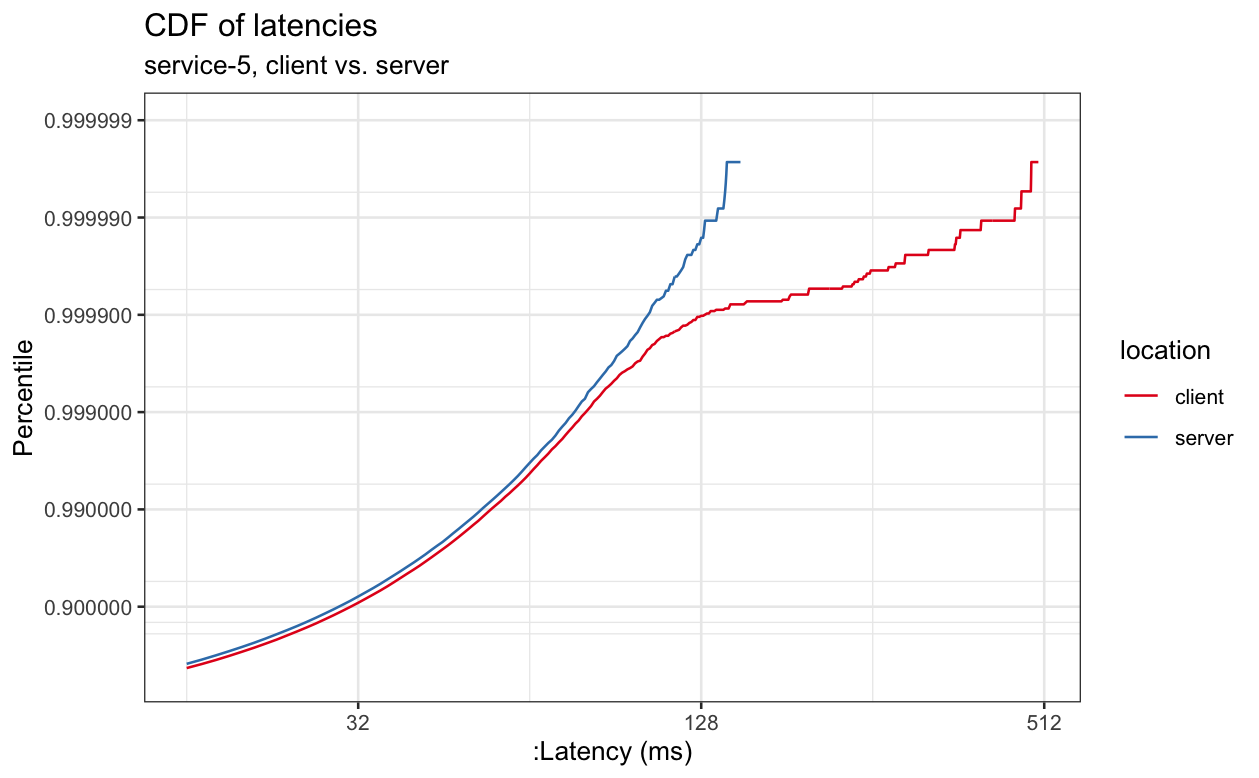
Below are a handful examples of cluster-wide measurements of latency measured at the client vs. the server. These were deliberately selected to show a cross-section of deltas between the client and the server.
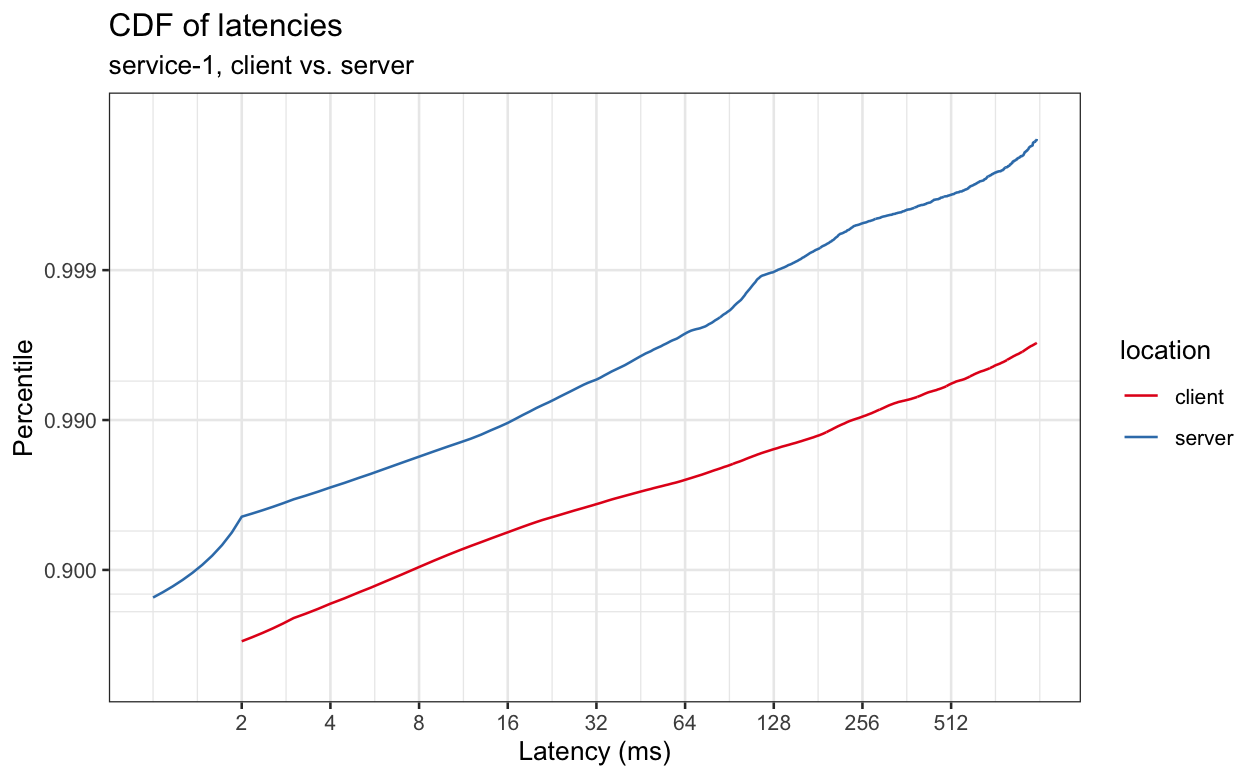
This is a CDF, presented with the standard orientation for a CDF, with the percentile is on the y-axis and the value on the x-axis, which makes down and to the right higher latency and up and to the left lower latency, and a flatter line meaning latency is increasing quickly and a steeper line meaning that latency is increasing more slowly.
Because the chart is log scale on both axes, the difference between client and server latency is large even though the lines don't look all that far apart. For example, if we look at 99%-ile latency, we can see that it's ~16ms when measured at the server and ~240ms when measured at the client, a factor of 15 difference. Alternately, if we look at a fixed latency, like 240ms, and look up the percentile, we see that's 99%-ile latency on the client, but well above 99.9%-ile latency on the server.
The graphs below have similar properties, although the delta between client and server will vary.
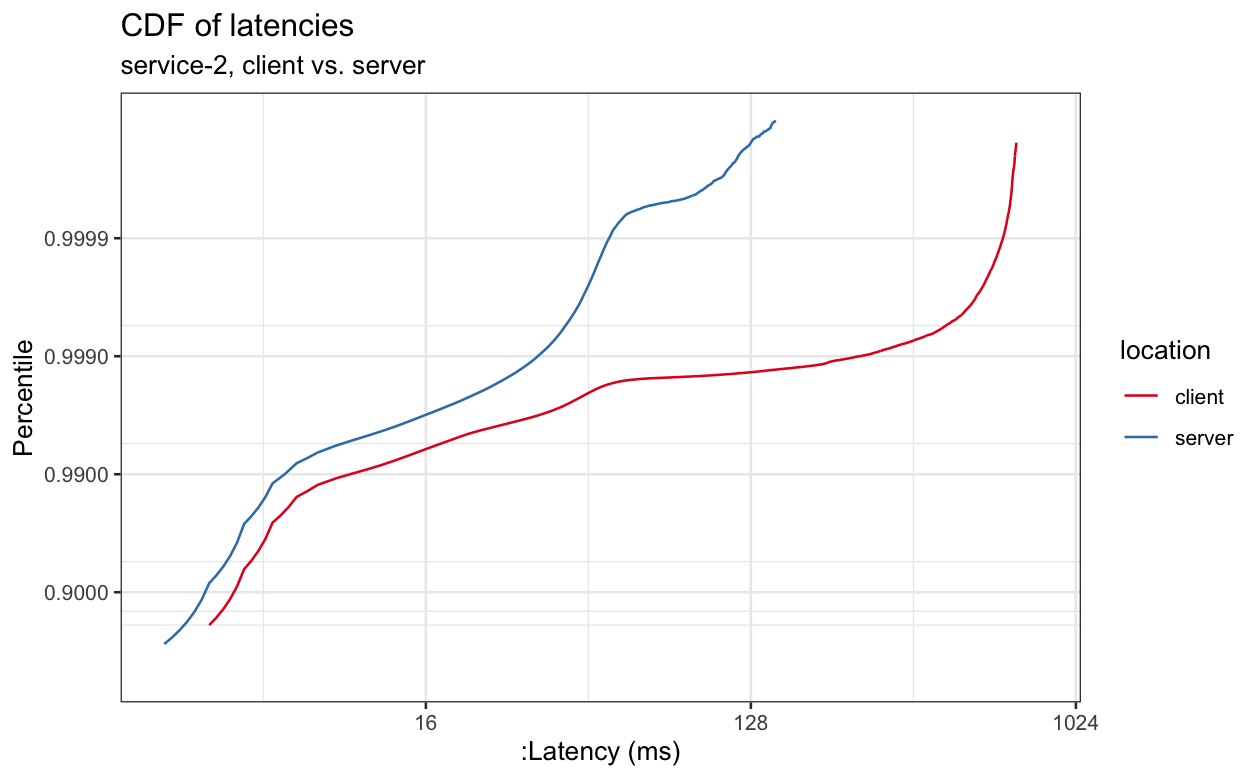
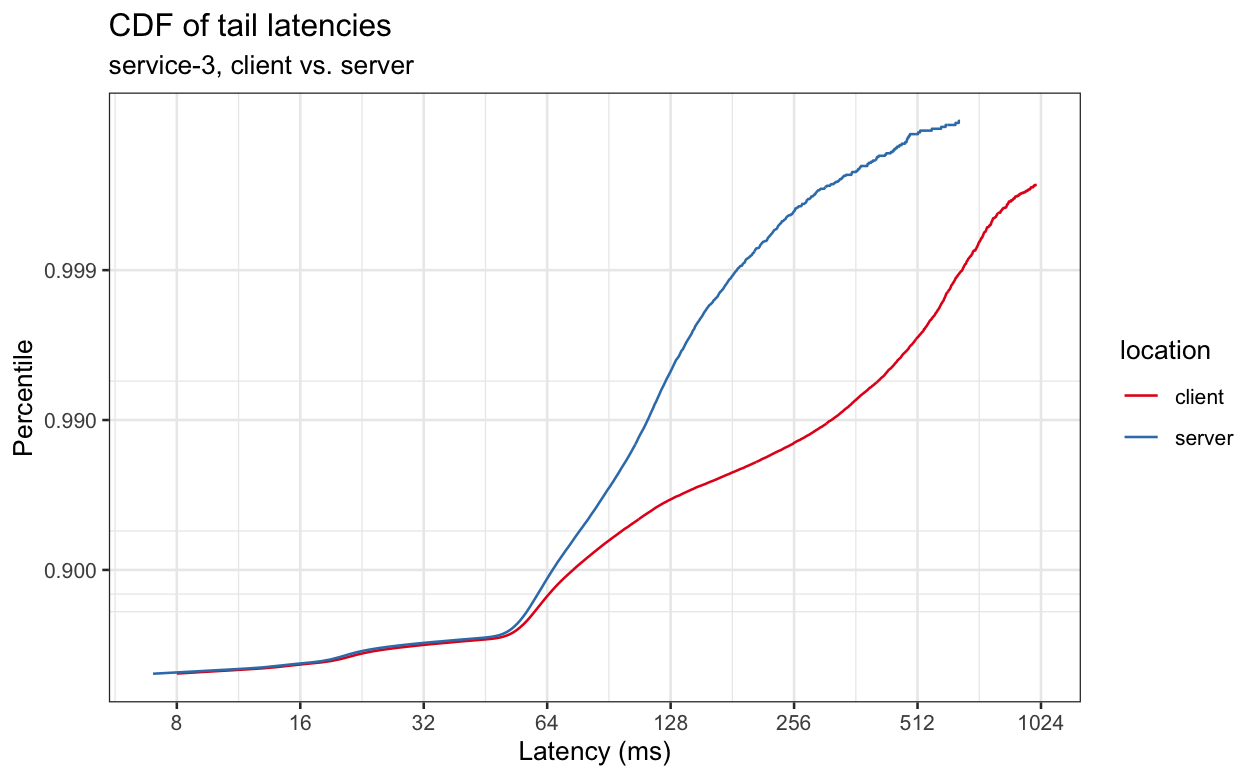
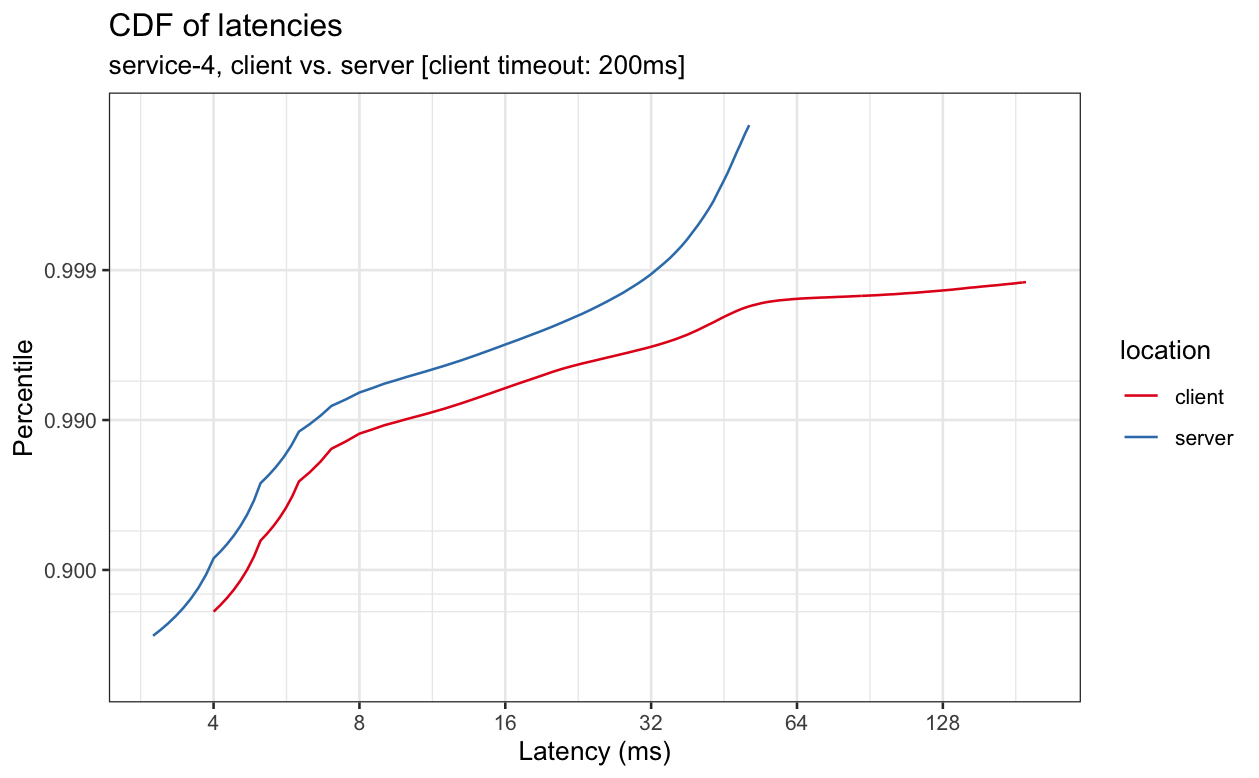
We can see that latencies often differ significantly when measured at the client vs. when measured at the server and that, even in cases where the delta is small for lower percentiles, it sometimes gets large at higher percentiles, where more load can result in more queueing and therefore more latency in netty and the kernel.
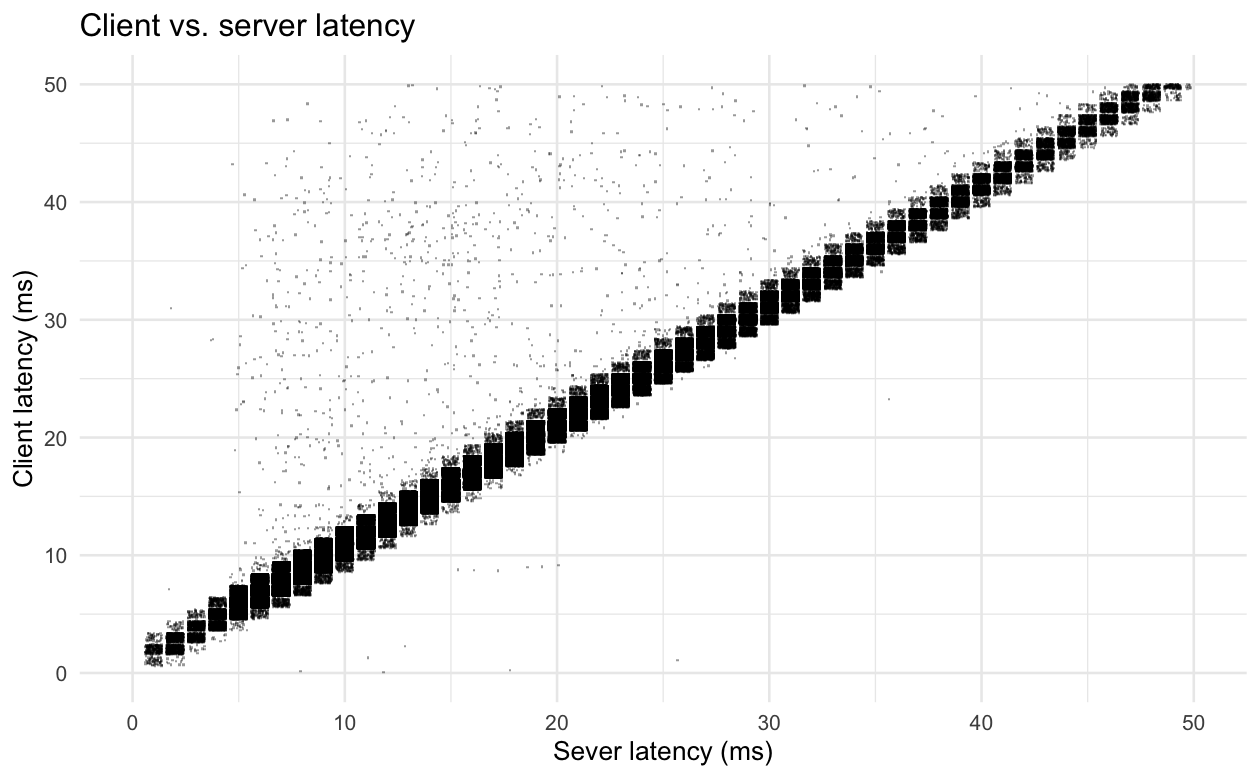
One thing to note is that, for any particular measured server latency value, we see a very wide range of client latency values. For example, here's a zoomed in scatterplot of client vs. server latency for service-5. If we were to zoom out, we'd see that for a request with a server-measured latency of 10ms, we can see client-measured latencies as high as 500ms. More generally, we see many requests where the server-measured latency is very similar to the client-measured latency, with a smattering of requests where the server-measured latency is a very inaccurate representation of the client-measured latency. In almost all of those cases, the client-measured latency is higher due to queuing in a part of the stack that's opaque to us and, in a (very) few cases, the client-measured latency is lower due to some issues in our instrumentation. In the plot below, due to how we track latencies, we only have 1ms granularity on latencies. The points on the plots below have been randomly jittered by +/- 0.4ms to give a better idea of the distribution at points on the plot that are very dense.
While it's possible to plumb instrumentation through netty and the kernel to track request latencies after Finagle has handed them off (the kernel even has hooks that would make this somewhat straightforward), that's probably more work than is worth it in the near future. If you want to get an idea for how your service is impacted by opaque latency, it's fairly easy to get a rough idea with Zipkin if you leverage the work Rebecca Isaacs, Jonathan Simms, and Rahul Iyer have done, which is how I generated the plots above. The code for these is checked into [a path in our monorepo] and you can plug in your own service names if you just want to check out a different service.
Lack of cluster-wide aggregation capability
In the examples above, we were able to get cluster-wide latency percentiles because we used data from Zipkin, which attempts to sample requests uniformly at random. For a variety of reasons, service owners mostly rely on metrics data which, while more complete because it's unsampled, doesn't let us compute cluster-wide aggregates because we pre-compute fixed aggregations on a per-shard basis and there's no way to reconstruct the cluster-wide aggregate from the per-shard aggregates.
From looking at dashboards of our services, the most common latency target is a per-shard average of shard-level 99%-ile latency (with some services that are deep in the request tree, like cache, using numbers further in the tail). Unfortunately, taking the average of per-shard tail latency defeats the purpose of monitoring tail latency. If we think about why we want to use tail latency because, when we have high fanout and high depth request trees, a very small fraction of server responses slowing down can slow down many or most top-level requests, taking the average of tail latency fails to capture the value of using tail latency since the average of shard-level tail latencies fails to capture the property that a small fraction of server responses being slow can slow down many or most requests while also missing out on the advantages of looking at cluster-wide averages, which can be reconstructed from per-shard averages.
For example, when we have a few bad nodes returning , that has a small impact on the average per-shard tail latency even though cluster-wide tail latency will be highly elevated. As we saw in [a document quantifying the extent of machine-level issues across the fleet as well as the impact on data integrity and performance], we frequently have host-level issues that can drive tail latency on a node up by one or more orders of magnitude, which can sometimes drive median latency on the node up past the tail latency on other nodes. Since a few or even one such node can determine the tail latency for a cluster, taking the average across all nodes can be misleading, e.g., if we have a 100 node cluster where tail latency is up by 10x on one node, this might cause our average of cluster-wide latencies to increase by a factor of 0.99 + 0.01 * 10 = 1.09 when the actual increase in tail latency is much larger.
Some service owners try to get a better approximation of cluster-wide tail latency by taking a percentile of the 99%-ile, often the 90%-ile or the 99%-ile, but this doesn't work either and there is, in general, no per-shard percentile or other aggregation of per-shard tail latencies that can reconstruct the cluster-level tail latency.
Below are plots of the various attempts that people have on dashboards to get cluster-wide latency with instance-level metrics data vs. actual (sampled) cluster-wide latency on a service which makes the percentile of percentile attempts more accurate than for smaller services. We can see the correlation is very weak and has the problem we expect, where the average of the tail isn't influenced by outlier shards as much as it "should be" and the various commonly used percentiles either aren't influenced enough or are influenced too much, on average and are also weakly correlated with the actual latencies. Because we track metrics with minutely granularity, each point in the graphs below represents one minute, with the sampled cluster-wide p999 latency on the x-axis and the dashboard aggregated metric value on the y-axis. Because we have 1ms granularity on individual latency measurements from our tracing pipeline, points are jittered horizontally +/- 0.3ms to give a better idea of the distribution (no such jitter is applied vertically since we don't have this limitation in our metrics pipeline, so that data is higher precision).
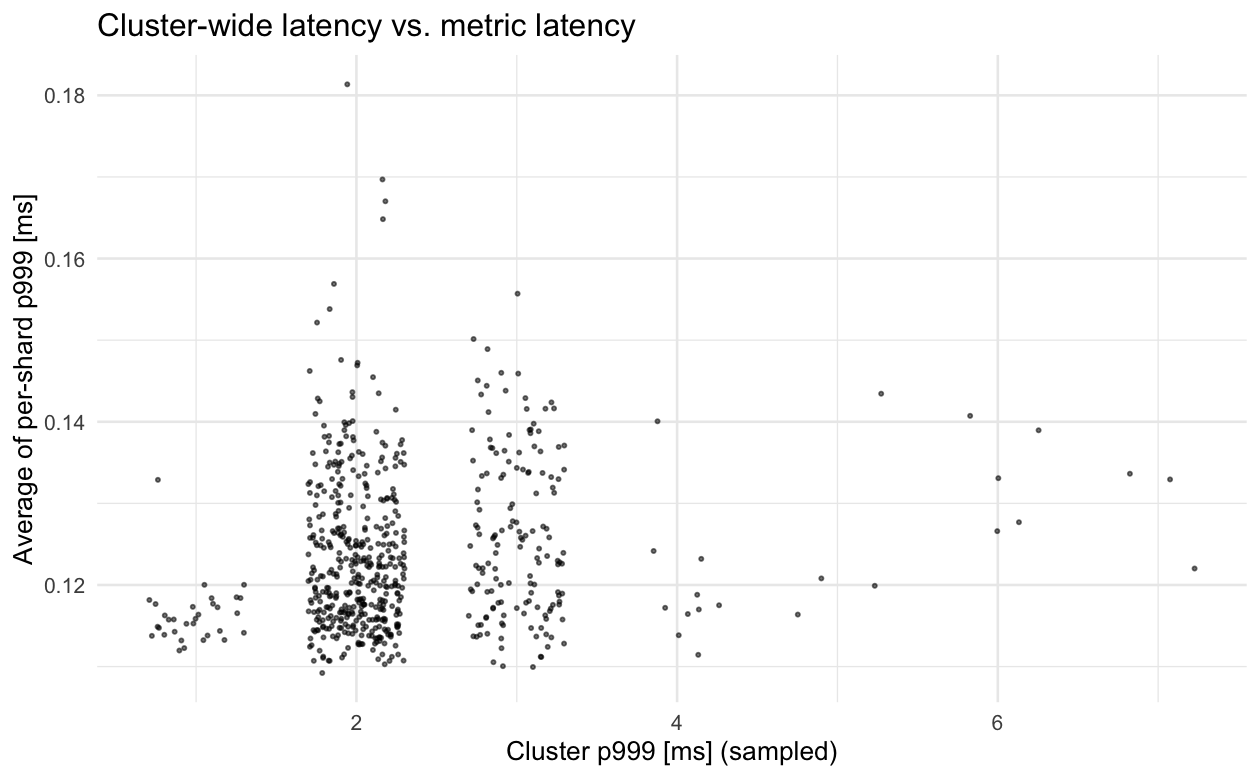
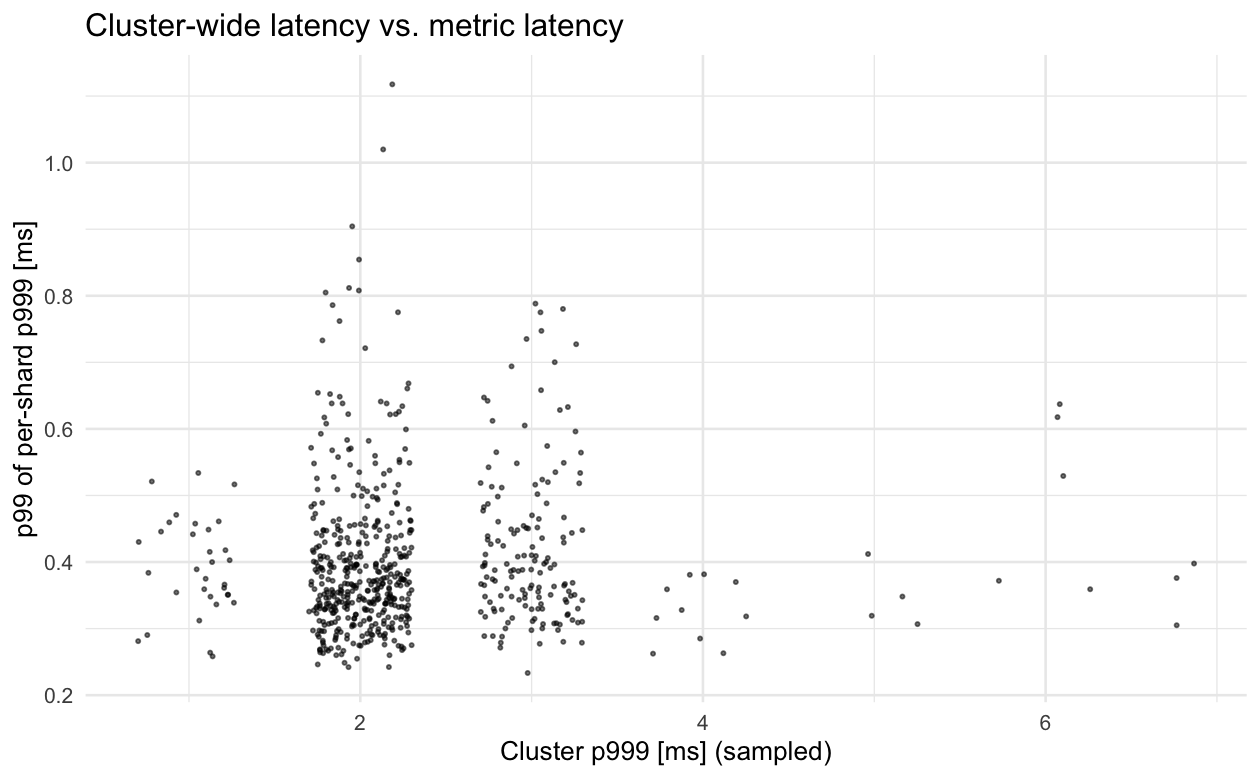
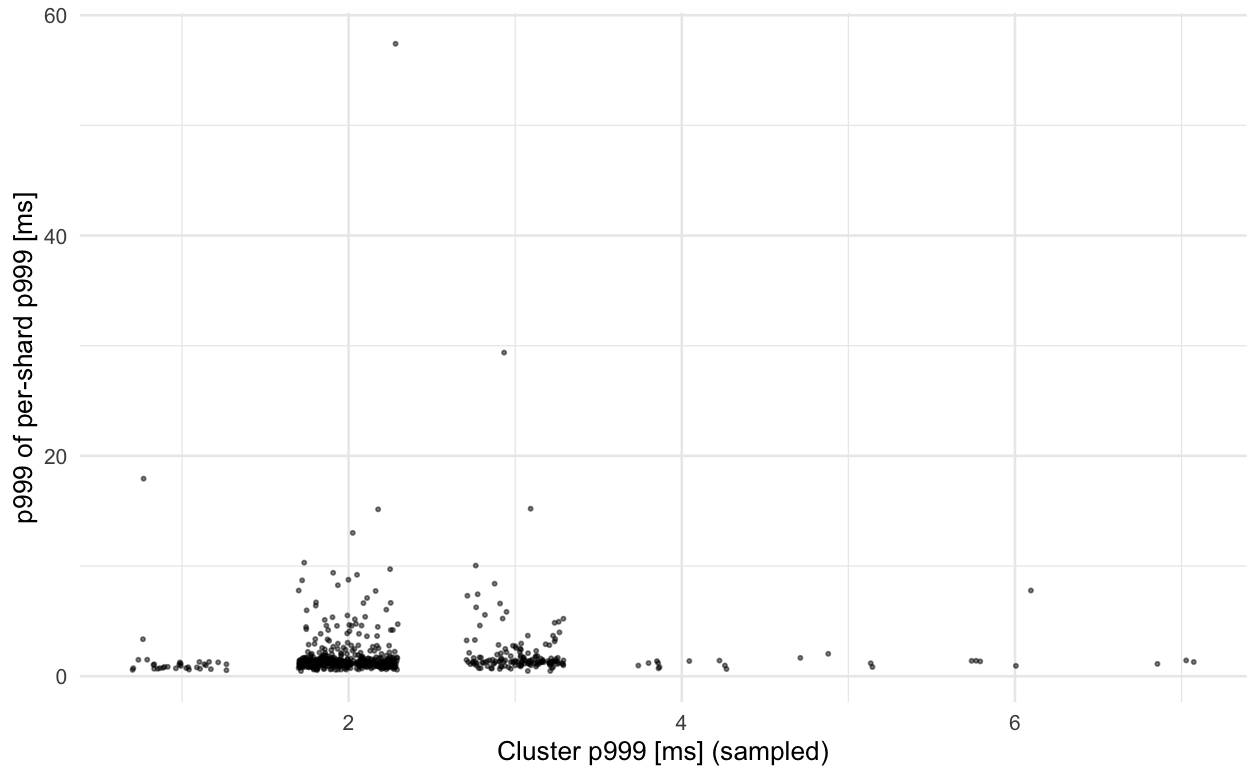
The correlation between cluster-wide latency and aggregations of per-shard latency is weak enough that even if you pick the aggregation that results in the correct average behavior, the value will still be quite wrong for almost all samples (minutes). Given our infra, the only solutions that can really work here are extending our tracing pipeline for use on dashboards and with alerts or adding metric histograms to Finagle and plumbing that data up through everything and the into [dashboard software] so that we can get proper cluster-level aggregations.
While it's popular to take the average of tail latencies because it's easy and people are familiar with it (e.g., the TL of observability at [redacted peer company name] has said that they shouldn't bother with anything other than averages because everyone just wants averages), taking the average or another aggregation of shard-level tail latencies has neither the properties people want nor the properties people expect.
Minutely resolution
Another, independent, issue that's a gap in our ability to observe what's going on with our infrastructure is that we only collect metrics at a minutely granularity. Rezolus does metrics collection on a secondly (and in some cases, even sub-secondly) granularity, but for reasons that are beyond the scope of this talk, it's generally only used for system-level metrics (with a few exceptions).
We've all seen incidents where some bursty, sub-minutely event, is the cause of a problem. Let's look at an example of one such incident. In this incident, a service had elevated latency and error rate. Looking at the standard metrics we export wasn't informative, but looking at sub-minutely metrics immediately reveals a clue:
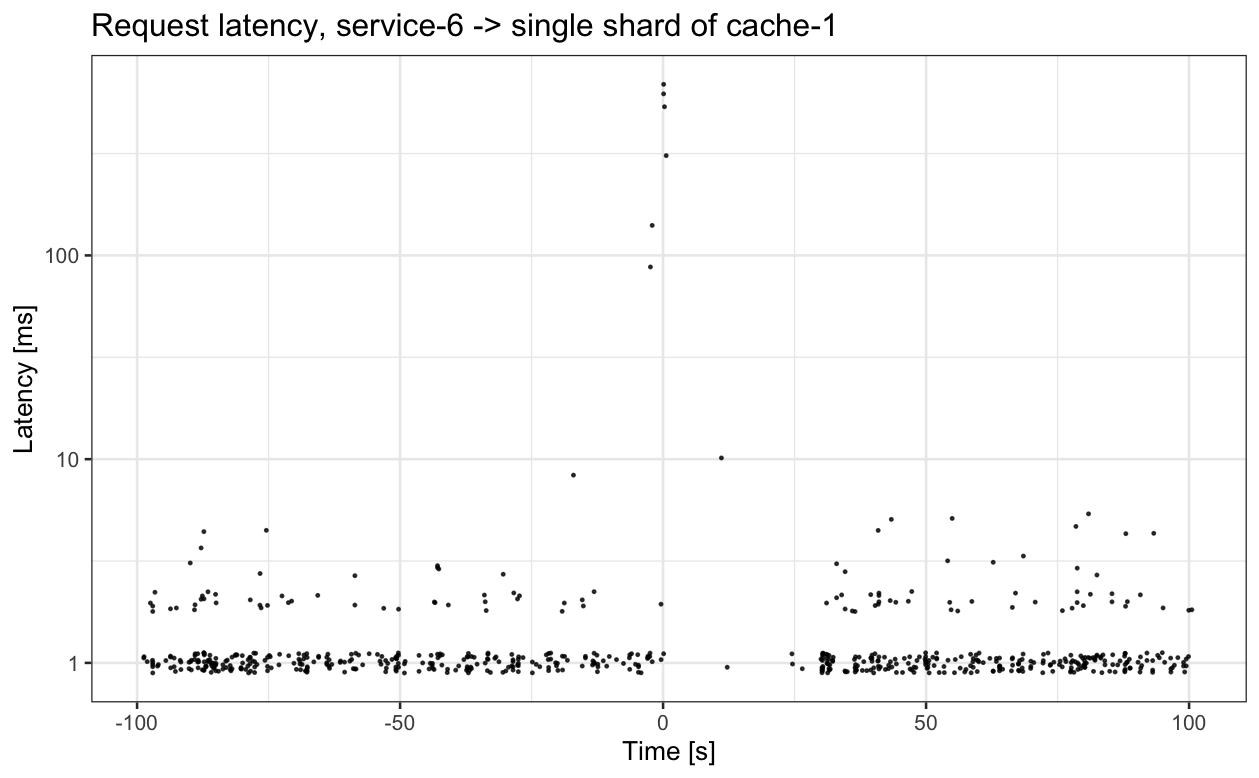
For this particular shard of a cache (and many others, not shown), there's a very large increase in latency at time 0, followed by 30 seconds of very low request rate. The 30 seconds is because shards of service-6 were configured to mark servers they talk to as dead for 30 seconds if service-6 clients encounter too many failed requests. This decision is distributed, which is why the request rate to the impacted shard of cache-1 isn't zero; some shards of service-6 didn't send requests to that particular shard of cache-1 during during the period of elevated latency, so they didn't mark that shard of cache-1 as dead and continued to issue requests.
A sub-minutely view of request latency made it very obvious what mechanism caused elevated error rates and latency in service-6.
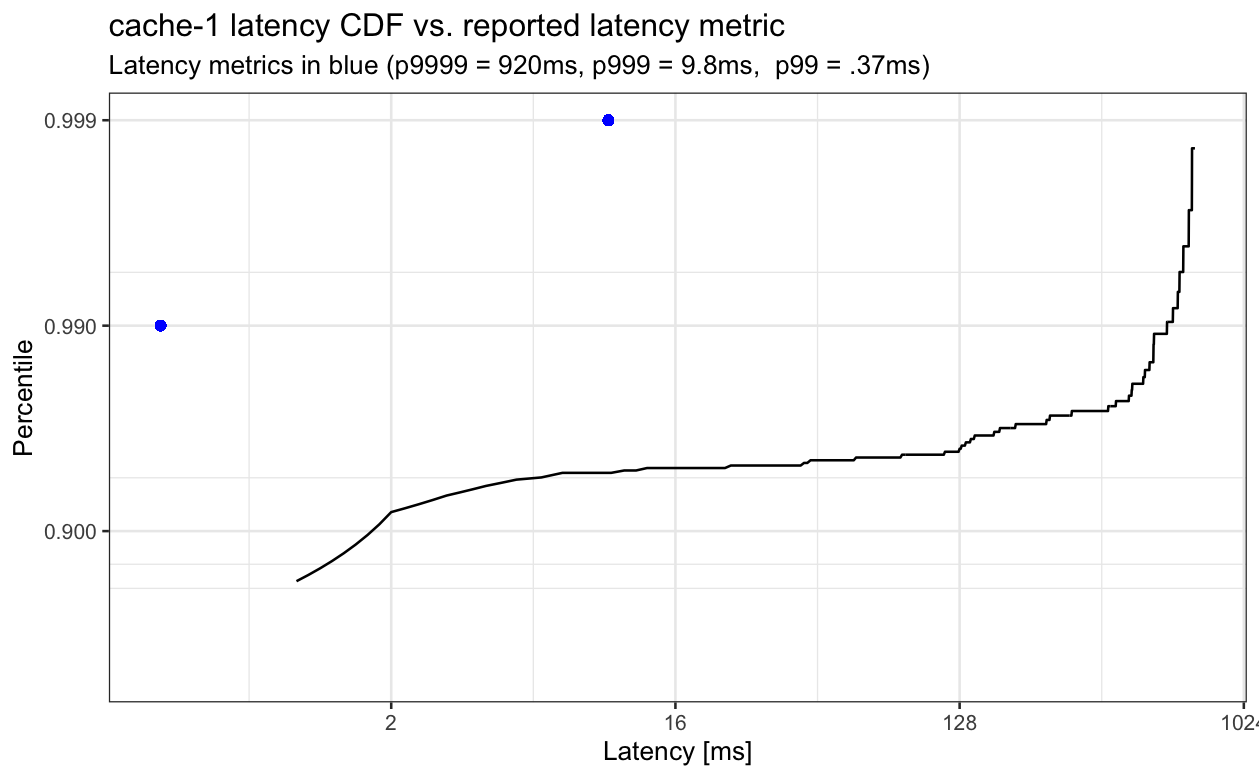
One thing to note is that the lack of sub-minutely visibility wasn't the only issue here. Much of the elevated latency was in places that are invisible to the latency metric, resulting in monitoring cache-1 latencies insufficient to detect the issue. Below, the reported latency metrics for a single instance of cache-1 are the blue points and the measured (sampled) latency the client observed is the black line. Reported p99 latency is 0.37ms, but actual p99 latency is ~580ms, an over three order of magnitude difference.
Summary
Although our existing setup for reporting and alerting on latency works pretty decently, in that the site generally works and our reliability is actually quite good compared to peer companies in our size class, we do pay some significant costs as a result of our setup.
One is that we often have incidents where it's difficult to see what's going on without using tools that are considered specialized that most people don't use, adding to the toil of being on call. Another is that, due to large margins of error in our estimates of cluster-wide latencies, we have to have to provision a very large amount of slack and keep latency SLOs that are much stricter than the actual latencies we want to achieve to avoid user-visible incidents. This increases operating costs as we've seen in [a document comparing per-user operating costs to companies that serve similar kinds of and levels of traffic].
If you enjoyed this post you might like to read about tracing on a single host vs. sampling profilers.
Appendix: open vs. closed loop latency measurements
Some of our synthetic benchmarking setups, such as setup-1, use "closed-loop" measurement, where they effectively send a single request, wait for it to come back, and then send another request. Some of these allow for a degree of parallelism, where N request can be in flight at once but that still has similar problems in terms of realism.
For a toy example of the problem, let's say that we have a service that, in production, receives exactly 1 request every second and that the service has a normal response time of 1/2 second. Under normal behavior, if we issue requests at 1 per second, we'll observe that the mean, median, and all percentile request times are 1/2 second. As an exercise for the reader, compute the mean and 90%-ile latency if the service has no parallelism and one request takes 10 seconds in the middle of a 1 minute benchmark run for a closed vs. open loop benchmark setup where the benchmarking setup issues requests at 1 per second for the open loop case, and 1 per second but waits for the previous request to finish in the closed loop case.
For more info on this, see Nitsan Wakart's write-up on fixing this issue in the YCSB benchmark or Gil Tene's presentation on this issue.
Appendix: use of unweighted averages
An common issue with averages on dashboards that I've looked at that's independent of the issues that come up when we take the average of tail latencies is that an unweighted average frequently underestimates the actual latency.
Two places I commonly see an unweighted average are when someone gets an overall latency by taking an unweighted average across datacenters and when someone gets a cluster-wide latency by taking an average across shards. Both of these have the same issue, that shards that have lower load tend to have lower latency. This is especially pronounced when we fail away from a datacenter. Services that incorrectly use an unweighted average across datacenters will often show decreased latency even though actually served requests have increased latency.
Thanks to Ben Kuhn for comments/corrections/discussion.