We're going to look at three different kinds of benchmarks, one set of calculations for baseline numbers for performance "napkin math" estimates, one set of AI model evals, and one on car tires. To build my intuition for things, I like thinking about them before seeing the explanation, so these are presented with the benchmark information first and the explanation later in case you want to think about your answer before seeing my thoughts.
29. A friend of mine is reviewing performance orders of magnitude to prep for computer performance interviews and found that https://github.com/sirupsen/napkin-math (5.4k stars) was the top hit. The README's tables include:
| Operation | Latency | Throughput | 1 MiB | 1 GiB |
|---|---|---|---|---|
| Sequential Memory R/W (64 bytes) | 0.5 ns | |||
| ├ Single Thread | 20 GiB/s | 50 μs | 50 ms | |
| ├ Threaded | 200 GiB/s | 5 μs | 5 ms | |
| Network Same-Zone | 10 GiB/s | 100 μs | 100 ms | |
| ├ Inside VPC | 10 GiB/s | 100 μs | 100 ms | |
| ├ Outside VPC | 3 GiB/s | 300 μs | 300 ms | |
| Hashing, not crypto-safe (64 bytes) | 10 ns | 5 GiB/s | 200 μs | 200 ms |
| Random Memory R/W (64 bytes) | 20 ns | 3 GiB/s | 300 μs | 300 ms |
Fast Serialization [8] [9] † | N/A | 1 GiB/s | 1 ms | 1s |
Fast Deserialization [8] [9] † | N/A | 1 GiB/s | 1 ms | 1s |
| System Call | 300 ns | N/A | N/A | N/A |
| Hashing, crypto-safe (64 bytes) | 100 ns | 1 GiB/s | 1 ms | 1s |
| Sequential SSD read (8 KiB) | 1 μs | 8 GiB/s | 100 μs | 100 ms |
Context Switch [1] [2] | 10 μs | N/A | N/A | N/A |
| Sequential SSD write, -fsync (8KiB) | 2 μs | 3 GiB/s | 300 μs | 300 ms |
| TCP Echo Server (32 KiB) | 50 μs | 500 MiB/s | 2 ms | 2s |
| Random SSD Read (8 KiB) | 100 μs | 70 MiB/s | 15 ms | 15s |
Decompression [11] | N/A | 1 GiB/s | 1 ms | 1s |
Compression [11] | N/A | 500 MiB/s | 2 ms | 2s |
| Sorting (64-bit integers) | N/A | 500 MiB/s | 2 ms | 2s |
| Proxy: Envoy/ProxySQL/Nginx/HAProxy | 50 μs | ? | ? | ? |
| Network within same region | 250 μs | 2 GiB/s | 500 μs | 500 ms |
| Premium network within zone/VPC | 250 μs | 25 GiB/s | 50 μs | 40 ms |
| Sequential SSD write, +fsync (8KiB) | 300 μs | 30 MiB/s | 30 ms | 30s |
| {MySQL, Memcached, Redis, ..} Query | 500 μs | ? | ? | ? |
Serialization [8] [9] † | N/A | 100 MiB/s | 10 ms | 10s |
Deserialization [8] [9] † | N/A | 100 MiB/s | 10 ms | 10s |
| Sequential HDD Read (8 KiB) | 10 ms | 250 MiB/s | 2 ms | 2s |
| Random HDD Read (8 KiB) | 10 ms | 0.7 MiB/s | 2 s | 30m |
| Blob Storage GET, if-not-match 304 | 30 ms | |||
| Blob Storage GET, 1 conn (128KiB) | 80 ms | 100 MiB/s | 10 ms | 10s |
| Blob Storage GET, n conn (offsets) | 80 ms | NW limit | ||
| Blob Storage LIST | 100 ms | |||
| Blob Storage PUT, 1 conn (128KiB) | 200 ms | 100 MiB/s | 10 ms | 10s |
| Blob Storage PUT, n conn (multipart) | 200 ms | NW limit | 10 ms | 10s |
Network between regions [6] | Varies | 25 MiB/s | 40 ms | 40s |
| Network NA Central <-> East | 25 ms | 25 MiB/s | 40 ms | 40s |
| Network NA Central <-> West | 40 ms | 25 MiB/s | 40 ms | 40s |
| Network NA East <-> West | 60 ms | 25 MiB/s | 40 ms | 40s |
| Network EU West <-> NA East | 80 ms | 25 MiB/s | 40 ms | 40s |
| Network EU West <-> NA Central | 100 ms | 25 MiB/s | 40 ms | 40s |
| Network NA West <-> Singapore | 180 ms | 25 MiB/s | 40 ms | 40s |
| Network EU West <-> Singapore | 160 ms | 25 MiB/s | 40 ms | 40s |
What's wrong with this benchmark?
30. I keep seeing people reference DeepSWE and Senior SWE-Bench to "prove" that their favorite model is better than other people's favorite models or just as generally good benchmarks, such as in
What's wrong with these benchmarks?
31. People frequently say that winter tires are superior to all-season tires in cold weather. For example, on googling "all season tires during winter cold" (no quotes), the Google AI summary leads with
All-season tires lose traction and stiffen in freezing winter temperatures. Their rubber compounds are designed for warmer weather and become hard below 7°C (45°F), leading to significantly longer braking distances and reduced grip ... The rubber in all-season tires cannot maintain pliability in sub-zero temperatures, causing them to perform more like hard plastic on snow and ice.
Given that there are a lot of internet comments in the training data, this is a reasonable comment, in that I frequently see variations on this comment on discussions of which tires one should use.
What's wrong with this benchmark?
29. Napkin math numbers
Random memory access latency
The thing that immediately jumped out to my friend (Jamie) as odd was random memory R/W listed as 20ns, since random memory R/W is implied to be a real DRAM read (as opposed to a cache hit), which he felt this should be around 100ns for an order of magnitude estimate.
As we were chatting about this, he noted that the README uses the term "latency" for some things that aren't really latencies. Then, when he pulled up the code for random memory read latency, he found the following (if you want another exercise, consider what's wrong with the following code before reading the explanation below):
  while test.i < test.vec.len() {
      let random_index = test.order[test.i];
      black_box(test.vec[random_index]);
      test.i += 1;
  }
Jamie noted that there's no data dependency between the loop iterations, so the memory reads here happen in parallel. Since the alleged latency number is determined by finding the average time for an access, this is incorrect because the CPU can have multiple loads in flight at once. If you wanted to measure latency this way, you'd have to introduce a dependence between loads, to prevent overlapping accesses (we discussed a related topic in exercise 19, covered in part 4 of this series).
Random SSD read
I agree with all of Jamie's comments, although I didn't really flag the use of the term latency myself because maybe it's shorthand for latency in some cases and something a bit latency-like in other cases (such as reciprocal throughput), which makes the table simpler.
What first jumped out to me, besides the memory latency number, was some of the other numbers. For example, random SSD read is listed as 100 us / 70 MB/s. You can get much faster (as well as much slower) SSDs. For example, if you have a fast (but non-exotic, e.g., non Optane) device, you might see latencies below 40us, e.g., the Kioxia CD9P-R was measured at ~30 us here. Other than for some trivial scripts, I haven't worked on anything where I care about disk performance, so I don't have an intuition for what numbers someone would want to have in mind1, but I also wonder if having a single number for random read latency and throughput is less useful than it is for DRAM accesses. Whenever I've looked at disk benchmarks, it seems like there's a huge range of results based on read size, queue depth, and number of jobs (e.g., see the previous link on the Kioxia CD9P-R). Of course, there are analogous factors that influence DRAM latency and bandwidth, but it seems like you're much more often in a regime where knowing one or two numbers is helpful when thinking about memory accesses. Since I don't know anything about disk performance, I asked Peter Geoghegan, who's done work on Postgres disk performance; he concurred and also wrote some additional comments on the complexity of disk performance below
If we look at the code for this SSD random read number, it feels off to me in the same way that the random memory read code felt off to Jamie. It generates offsets with
for i in 0..(buffer.len() / page_size) {
    pages.push((i * page_size + 1) as u64);
}
and then does 8 KiB reads (offsets are shuffled to create random reads). Some things that don't feel right about this are:
- The +1 makes every read unaligned. With a 4KiB page size, this makes one read touch 3 pages
- Different offsets can overlap the same pages, causing seemingly unintended reads from page cache
- Depending on the page size, reads can extend past the end of the file and cause a panic
The "buffer.len() / page_size" construction seems to be intended to keep accesses in bounds, but this is independent of the access length. If we want to be lazy and not think about exact offsets, consider some huge access length like 4 GiB (the buffer size is 8 GiB). That will surely overflow. If we want to be more precise, the overflow case will be more like a 4KiB page with 8KiB access length, but the same idea applies.
The very last offset is going to be SIZE - 4096 + 1. This gives us 4095 bytes we can access, but we try to access 8192 bytes. Because the benchmark only runs for 5 seconds, it may or may not actually try to read past EOF and fail, but there's a bug here regardless of whether or not it randomly fails on any given run.
Sequential SSD read
Just looking at the code, a lot of it doesn't feel quite right to me. For example, consider the code that's used to generate the sequential 8 KiB SSD read, which is said to have 1us latency and 8 GiB/s throughput. Like I said, I haven't worked on any problems where disk performance matters, so I don't have an intuition on whether or not numbers like this are plausible, but the code feels off to me. The code takes a 1 GiB file, flushing it, and then re-reading it repeatedly, so we'll have one uncached read followed by cached reads. It seems like the intent is to measure uncached reads here, but if the intent is to measure cached reads, the code isn't doing that either (this appears to be an issue for some of the other numbers as well, such as 3 GiB/s of fsync'd reads). One could argue that it's realistic to have an uncached read followed by cached reads, but it's not clear what someone who's using the aggregate number of 1 uncached read followed by N cached reads should do with the number when they don't have the exact same workload; N isn't stated in an obvious way, so they wouldn't even know if they have the same workload.
Since I have no idea what the numbers should be here, maybe we can look up some numbers. The measurement was said to be done on a c4-standard-48-lssd. Google's docs for that instance claim that the maximum throughput for all 8 attached disks is 5000 MiB/s (from Google's table, this scales per number of attached disks and is 625 MiB/s per disk). From the very little I know of disk benchmarks, it seems like peak throughput numbers are generally done when using larger reads, so 8 GiB/s seems excessive and the feeling that something is off from the code seems to be right. And if we look at other numbers, it seems like the broader point that having a few single numbers for specific read sizes isn't representative of disk performance in general.
Representativeness
But the idea behind this kind of "napkin math" generally isn't to know how exactly one cloud instance performs; it's to get some basic numbers that can be used to estimate performance in various ways. If we look back to the Kioxia CD9P benchmarks, there are plenty of read benchmarks with higher bandwidth than that, with various parameters (and also plenty with lower bandwidth, with various parameters). For latency, the latency is higher even for sequential reads at settings that minimize latency (including for the other disks in the benchmark), which is another sign that the sirupsen benchmark is inadvertently reading from cache, but even if the numbers were correct, it's not clear what you'd do with the numbers.
It seems like the sirupsen code has an attempt to prevent caching and prefetching. If it detects the test is being run on Linux, it sets an advisory POSIX_FADV_RANDOM and, before the test starts, it sets an advisory POSIX_FADV_DONTNEED, but neither of these will prevent caching on this benchmark at the OS level, nor should these be expected to prevent lower-level caching (such as inside the SSD). On Mac, the benchmark calls Command::new("sudo").arg("purge").output().expect("failed to flush page cache") beforehand, but there's no equivalent of POSIX_FADV_RANDOM and there doesn't seem to be anything done on other OSes (such as BSD or Windows).
There are other issues in other parts of the code, but rather than get into the weeds on every specific issue and most of the presented values, if we come back to this idea that there are things where we want to get an idea of a range of numbers in different regimes, there are quite a few places where that seems to be the case. To pick another example, the README cites "Decompression" at 1 GiB/s and "Compression" at 500 MiB/s. Of course, any kind of napkin math isn't going to be precise, but just playing with different zstd compression options, we get more than two orders of magnitude difference in compression speeds and there are algorithms that are more specialized for high speed compression, giving an even larger range (and of course you can spend more effort to get lower speed and denser compression).
Going back to the disk example, we noted that the disk numbers come from a VM configuration with 8 disks. The numbers appear to be incorrect but, if the numbers were correct, of course you'd get different numbers for something like read bandwidth if you used a single-disk version of the VM. You'd expect roughly 1/8th the read bandwidth for the read benchmarks if it wasn't reading from the page cache. It's not clear why it's particularly useful to have a read bandwidth number for one particular 8-disk configuration on GCP memorized as a napkin math figure.
What's useful to learn?
Overall, I do find knowing some of these kinds of numbers useful, but I don't know that I'd necessarily want to look at a table to see the numbers (except maybe as interview prep that I'd expect to forget immediately after the interview if I had good reason to believe I'd be asked about them in an interview). In general, if you're doing things where it makes sense to know these numbers, you'll pick them up just by using them. For example, I still remember that dispersion in standard single-mode fiber is 17 ps / nm * km because I did some optics / photonics work twenty years ago. This comes up often enough in back-of-the-envelope calculations that you'll just remember this at some point if you use it enough. Likewise for various powers of 2 (e.g., 2^8 = 256, 2^16 = 65536, etc.), which I didn't try to memorize but picked up because, if you do enough coding where you touch these numbers, you end up remembering the numbers that often come in handy.
The linked napkin math repo notes that "numbers [are] rounded for memorization", implying that it makes sense to memorize these. In addition to what's mentioned above, a lot of these numbers are derivable and, in my opinion, if you're using these for work, it often makes sense to understand the derivation even if you have a ballpark number memorized. For example, we derived the single-core memory bandwidth number for a Sandy Bridge processor from some basic parameters in part 4. If you just want to know how fast a piece of code is going to run, you generally don't to rederive everything from first principles. But, if you're trying to understand the implications of changing something, it's helpful to know the what mechanisms are in play and how they'll interact, which is something you don't get from having a handful of numbers memorized.
Going back to the context for this question, my friend who was doing interview prep, the last concern he mentioned was that this repo is very popular, so the interviewer might be use it without knowing that most of the numbers that are listed are wrong.
Bonus info: memory latency over time
BTW, I was curious what memory latency is actually observed on real systems, so I plotted the data from the instlatx64 site, which reveals the following:
There are two graphs here because two different, non-comparable, methodologies were used. The original methodology used accesses with a 1024 byte stride to find memory latency, which worked fine for accesses over a large enough data set on older processors. Newer processors added mechanisms that can make this fail to be a pure DRAM access, so the newer methodology uses random accesses to find memory latency (some of the later numbers using the old methodology aren't really valid if you're thinking of them as a random memory access time). The latencies come from the instlatx64 site and the CPU release year was found by asking GPT-5.6 Sol ultra in codex without verifying the results, so some of the years are probably incorrect.
Just from eyeballing the graphs, we can see that memory latency improved tremendously for a while, but this improvement eventually stalled out and we actually see higher observed latencies over time for reasons that are outside the scope of the post.
690ns?
We also see some extremely high outlier results from the 90s. Without spending too much time looking at these results, it's not obvious that the results are incorrect. On the Intel side, the big outlier is an 83 MHz Intel Pentium Overdrive. The other old Intel results are all non-Overdrive Pentiums.
The Overdrive Pentiums were chips you could slap into a motherboard for a previous generation CPU. It looks like the test was run on a Gigabyte GA-5486AL motherboard with an ALi M1489/M1487 chipset set to a 33 MHz bus speed. According to the ALi M1489/M1487 datasheet, there are four possible DRAM read timings. If it's configured to the "normal" setting, a read page miss is CP+8, with a 4-4-4 read timing. I'm even less familiar with 486 bus timing than I am with disk performance, so I asked an LLM about this and it told me that this is correct and we should expect 21, 22, or 23 cycles for a memory access here. This doesn't feel quite right since, on asking the LLM what the heck these numbers mean, it's for the first word followed by each additional word, so that number of cycles is for a full cache line fill. The actual load-to-use latency for a word access should then be the first part, or 11 bus cycles, but if you want the time for the whole cache line, then the number seems plausibly like it's in the right benchmark.
On looking at the outlier AMD K5 PR166 result, there's something a bit odd about it, but we're pretty far off into the weeds on a question about modern computer performance, so maybe that can be another question for later in the series.
30. DeepSWE / Senior SWE-Bench
General plausibility
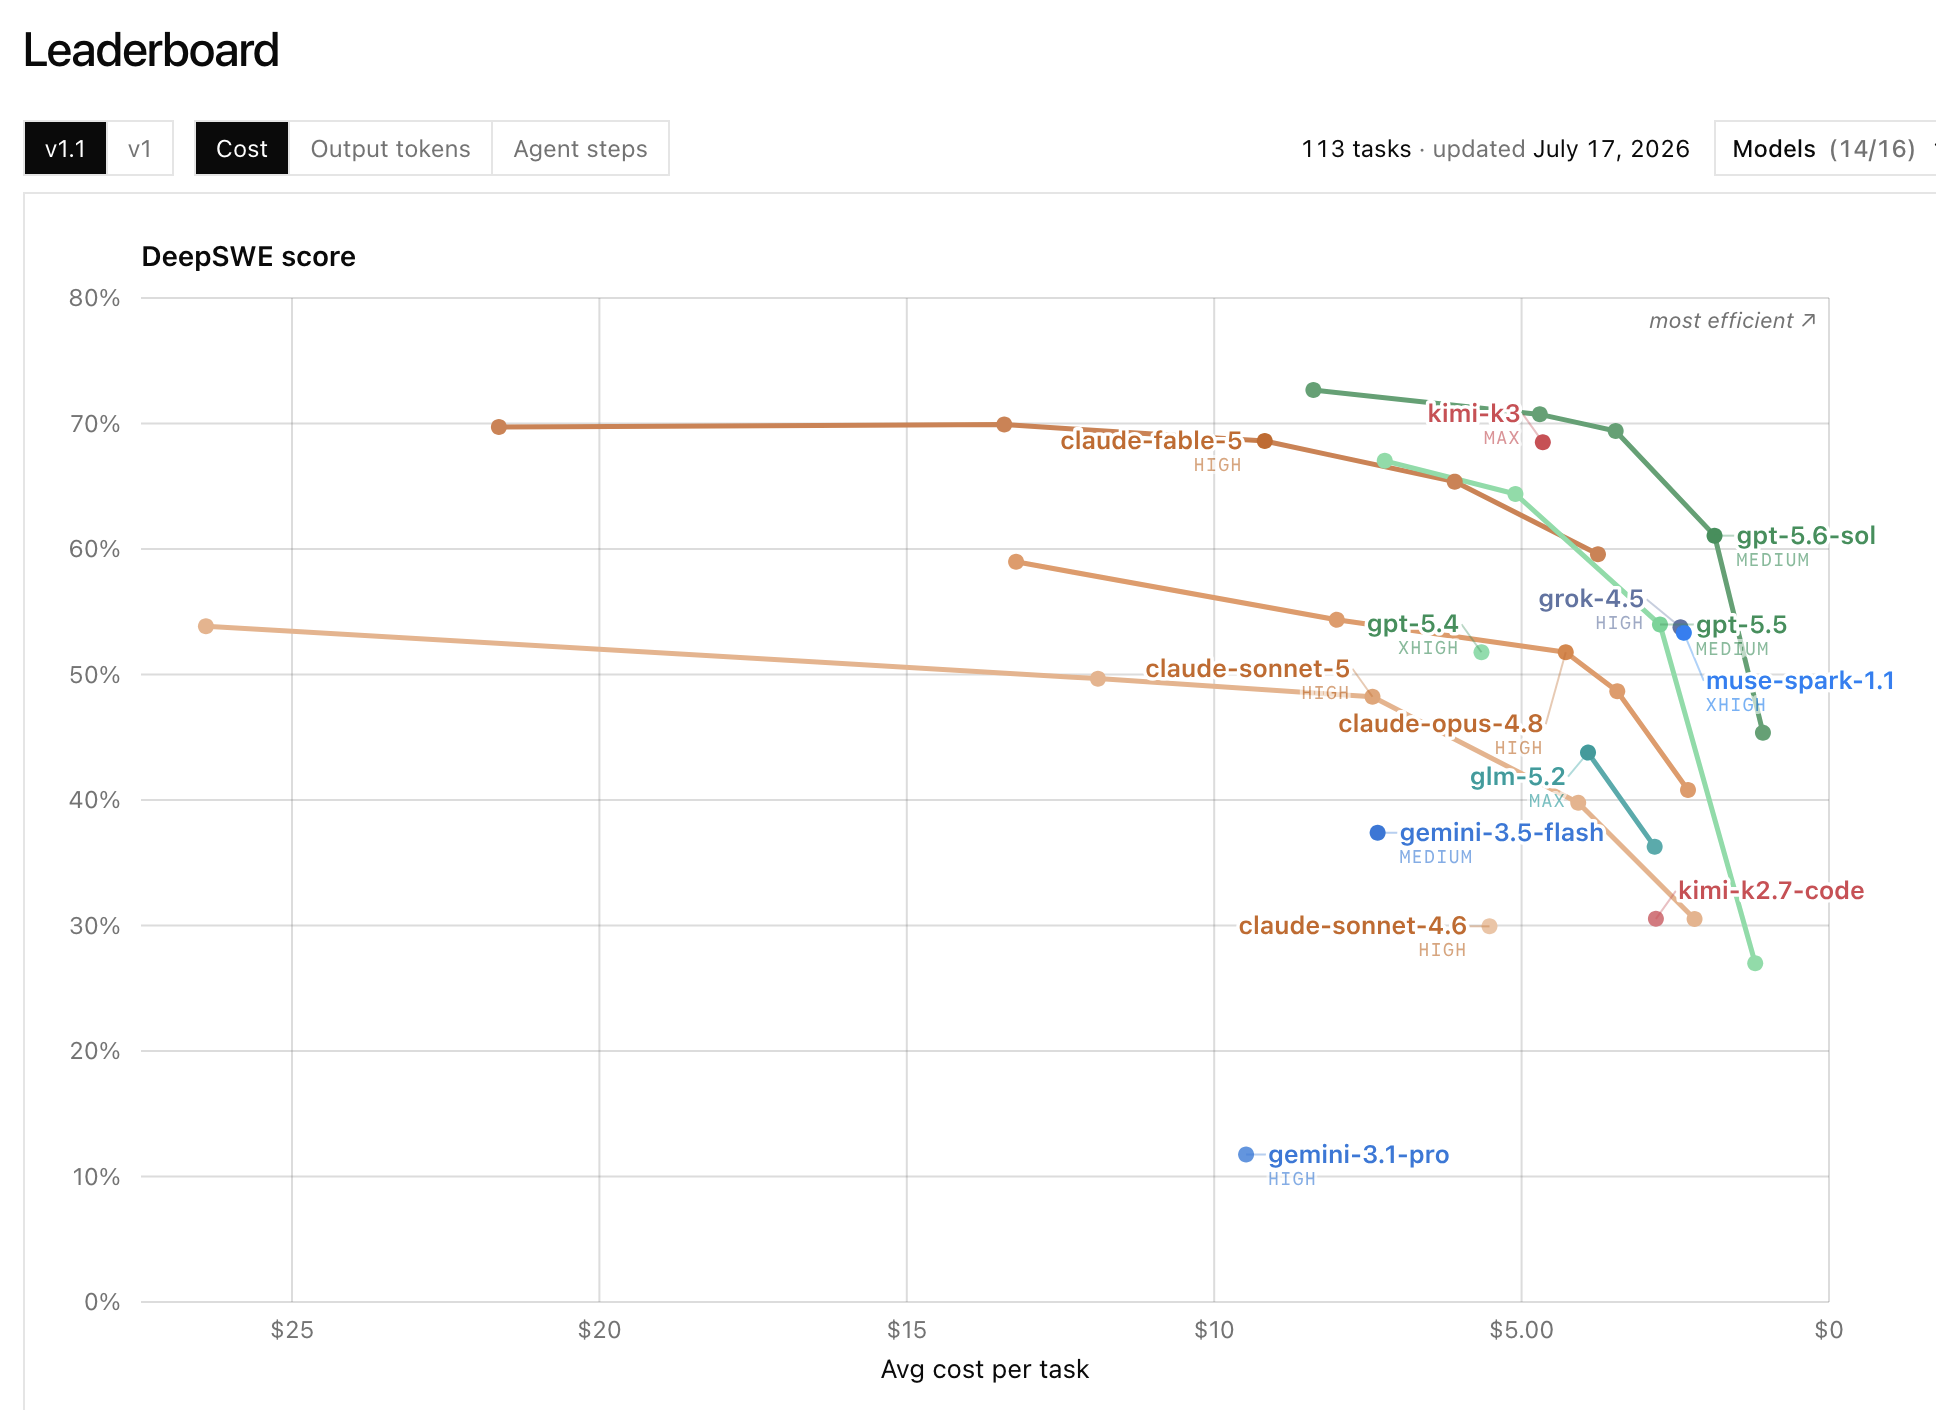
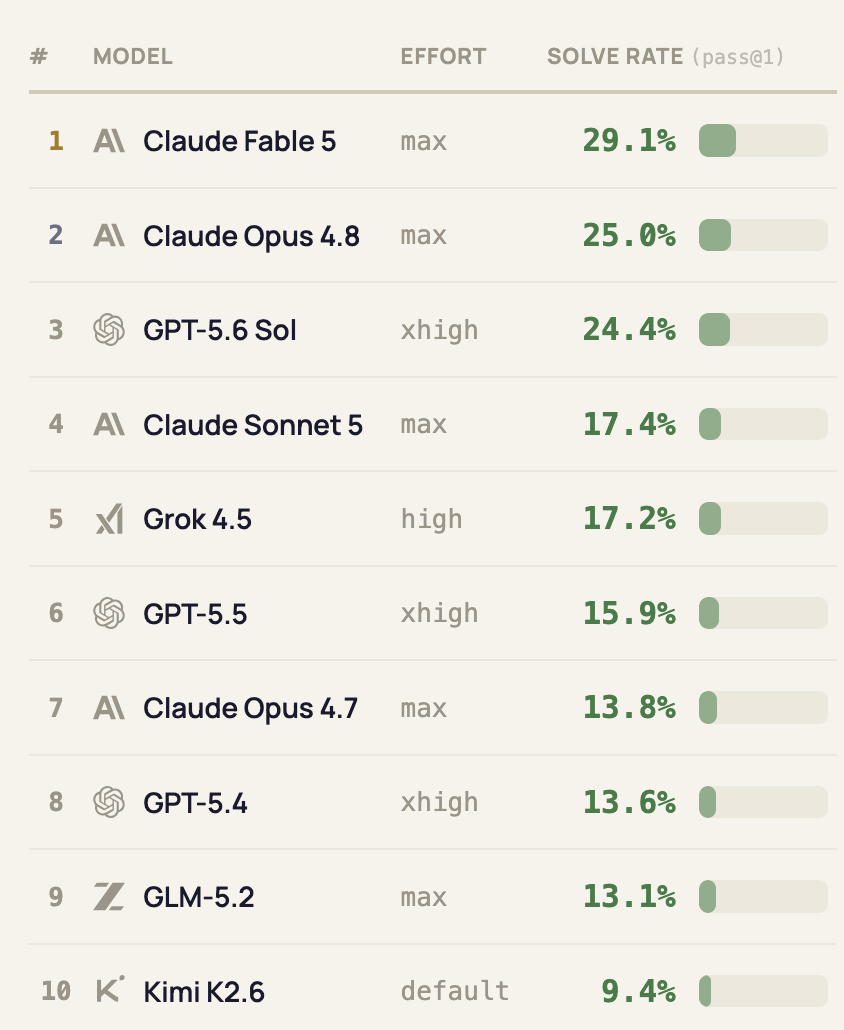
Before looking at the methodology of these benchmarks and just looking at the results, neither DeepSWE nor Senior SWE-Bench feel plausible as summaries for how well coding agents work overall. A surface-level reading of the DeepSWE homepage has OpenAI's last-generation model (GPT-5.5) being as good as Anthropic's current-generation model (Fable 5) and a surface-level reading of the Senior SWE-Bench has Anthropic's last-generation model (Opus 4.8) as being better than OpenAI's current generation model (GPT 5.6). In general, the surface-level reading is what most people will take away and this is how I generally see these used (e.g., in work slack, when people send these to me directly, etc.).
Methodlogy issues
If we look at how the sausage is made, very few of the publicly available benchmarks seem like reasonable things to rely on for getting a general idea of how good coding agents are. In terms of methodology, the benchmarks don't really make sense with respect to what you'd need to measure to get a generalizable result. Just like I don't know anything about disk performance, I don't know anything about AI, so I asked someone who ran an evals team at Anthropic for a while (Aaron Levin) to review the reasoning and conclusion and he concurred with the general idea and the reasoning. As with the consultation with the disk-performance expert, the point of this isn't to say that you should agree because an expert agrees; it's to say that, in these cases, you don't need any kind of specialized knowledge about the field to come to the same conclusion an expert would come to. You just need to apply the same kind of generic reasoning you'd use to evaluate any benchmarking or experimental design problem.
Summary score representativeness
In the last post, we discussed the high-level idea that a single summary score can say pretty much anything because, when we look at subbenchmark results, there will be plenty that favor model X over model Y and there isn't a particularly good way to, in general, sample the distribution of tasks out there to say that benchmark A is better than benchmark B because it's more representative.
If we look more at the details of these benchmarks, for DeepSWE, there are 113 tasks (or that's what codex told me, anyway), each one of which is run four times, with what generally appears to be a pass/fail score (models appear to score 0%, 25%, 50%, 75%, or 100% on each task). On the graph, we can see that GPT-5.5 is much better than Opus 4.8; the difference between GPT-5.5 and Opus 4.8 is about as large as the difference between Opus 4.8 and Gemini-3.5 Flash. As we noted above, if you've used these models, this doesn't really match the experience I or anyone whose judgement I trust has, overall (of course there are specific tasks or sub-benchmarks where this is true).
If we look at why this is supposedly the case, GPT-5.5 xhigh is allegedly a bit cheaper than Opus 4.8 xhigh and much better (scoring 67% vs. 54%). Of the 113 tasks, the models tie on 34 tasks, GPT-5.5 xhigh wins on 57 tasks, and Opus 4.8 wins on 22 tasks. For me or another programmer, this might be meaningful if these tasks are representative of tasks I or another programmer do. 113 tasks (or even just the 79 differing tasks) are more than we're going to look at in detail in this post, but from looking at the names of the tasks, few to none of them seem relevant to tasks I do at all. And then looking at language, of the tasks that differ, 4 tasks are in a language I often use coding agents for (Rust), and the rest of the tasks are in languages where I don't use coding agents or use them for trivial problems where any model is fine2.
The four Rust tasks where results differ are:
Hierarchical evaluation cancellation in Boa (https://deepswe.datacurve.ai/data/v1.1/tasks/boa-hierarchical-evaluation-cancellation), Deterministic multi-key sorting in fd (https://deepswe.datacurve.ai/data/v1.1/tasks/fd-deterministic-multi-key-sorting), Preserve stylesheet-selector structure in oxvg (https://deepswe.datacurve.ai/data/v1.1/tasks/oxvg-structural-selector-preservation), and Trap coredump generation in wasmi (https://deepswe.datacurve.ai/data/v1.1/tasks/wasmi-trap-coredumps). None of these seem all that related to things I use coding agents for, so this is worthless to me.
One of these seems vaguely like something I've done in the past year and the other three don't. We know from looking at individual benchmarks that there's significant variance in results between different benchmarks (for example, in the Optimization 1 benchmark in the last post, we get a vaguely DeepSWE-like model ranking, but in the GameAI we get a Senior SWE-Bench-like ranking, but as we also observed in that post, you can have one benchmark that nominally appears to resemble a task we care about that gives a result that's the opposite of what we see on the actual task, again because variance is very high). Having 1 out of 113 tasks sort of be similar to a task I've done means the DeepSWE benchmark score is meaningless to me personally.
Senior SWE-Bench
Moving on to the other benchmark, Senior SWE-Bench has all of the problems noted above, and it also presents the results in a more misleading way and has the additional issue of doing more subjective grading of results. I don't want to do one of these super long point-by-point teardowns, but to look at one issue with it, to qualify as a "tasteful solve", a solution has to meet multiple criteria, including scoring better than a certain score on a rubric and having a result that isn't >= 2x the length of a reference result.
Arbitrary and subjective scoring function
Without even looking at it more deeply, we already see this is a classic https://danluu.com/discontinuities/ situation. The benchmark has these continuous scores and then it introduces threshold effects by requiring a strict cutoff. From what I've seen, this kind of thing is often done because it makes things simpler, but if you believe the underlying criteria are important, in general, you often don't want to say that a score of X is a pass and a score of X-epsilon is a failure. Instead, the scores should be aggregated in some non-discontinuous way. I think there's often a hesitancy to do this because trying to write down a formula for this often makes it obvious that the weights are arbitrary and the score is meaningless. We probably know we don't want to give up to N extra score for a 1 LOC solution if the reference is R LOC, so we need some function that will cap the value there. Maybe we can cap the bonus at 2 by doing something like (2R)/(R+N). Maybe this doesn't penalize large functions enough, so we should switch to (2R^2)/(R^2+N^2). It might be easier to see the behavior of this if we write it as 1+tanh(ln(R/N)), so you can mentally substitute that if you prefer. We then need to combine this with the other scores, so we need to add at least M-1 of the M formulas so we have some relative weighting for them.
This would clearly be an arbitrary formula that's hard to justify. But the actual formula used has these discontinuities is another completely arbitrary function, but with worse properies that make it even harder to justify! It's just that whoever's writing it down doesn't have to think of it as a formula so they can avoid thinking about how arbitrary it is.
Threshold effects
If we look specifically at the LOC measure as defined by Senior SWE-Bench, of course we see threshold effects. For example, on https://senior-swe-bench.snorkel.ai/tasks/paperless-ngx-perf-workflow-queries, GLM-5.2 scores tasteful at 121 LOC vs. 61 for the reference. If there was one single LOC more, it would be 122, or double, which would cause GLM-5.2 to fail instead of pass. We can also see from the link that the benchmark was run once per condition. As anyone who's used LLMs knows and as we saw in the last post, there's tremendous variance between runs (quite often, there is commonly variance between runs than across different models and effort levels, which we observed in the last post), which already makes a single run not very meaningful when scored with some kind of reasonable continuous score. When noisy metrics like this then have information removed with these threshold effects, the result becomes even less meaningful.
That isn't even a particularly problematic benchmark with respect to the LOC score. plausible-fix-top-pages-comparison is worse because the reference solution is 1 LOC (since addition and deletion each count as 1 LOC, this is scored as 2 LOC). This makes the maximum size of a tasteful solve 3 LOC; if additions and deletions both happen, this would have to be 1 LOC deleted and 2 added or vice versa.
Code quality
If we look at the actual results, they don't make sense. We can see that, on this task, Opus 4.8 scores "tasteful" while Opus 4.7 and Fable 5 don't. If we look at the actual diffs and compare them to the reference solution, we find the following (note that only changes to the actual code count for the LOC criteria; test LOC, comments, etc., do not count).
Reference
  --- a/lib/plausible_web/controllers/api/stats_controller.ex
  +++ b/lib/plausible_web/controllers/api/stats_controller.ex
  @@ -723,7 +723,7 @@ defmodule PlausibleWeb.Api.StatsController do
       else
         json(conn, %{
           results: pages,
  -        meta: Map.merge(meta, Stats.Breakdown.formatted_date_ranges(query)),
  +        meta: Map.new(meta.values) |> Map.merge(Stats.Breakdown.formatted_date_ranges(query)),
           skip_imported_reason: meta[:imports_skip_reason]
         })
       end
Opus 4.8 (pass)
  --- CHANGELOG.md
  +++ CHANGELOG.md
  +- Fixed blank comparison dates in row tooltips on the Top Pages report

  --- lib/plausible_web/controllers/api/stats_controller.ex
  +++ lib/plausible_web/controllers/api/stats_controller.ex
  -        meta: Map.merge(meta, Stats.Breakdown.formatted_date_ranges(query)),
  +        meta: Map.merge(Map.new(meta), Stats.Breakdown.formatted_date_ranges(query)),

  --- test/plausible_web/controllers/api/stats_controller/pages_test.exs
  +++ test/plausible_web/controllers/api/stats_controller/pages_test.exs
  +      assert json_response(conn, 200)["meta"] == %{
  +               "date_range_label" => "2 Jan 2021",
  +               "comparison_date_range_label" => "1 Jan 2021"
  +             }
Opus 4.7 (fail)
  --- lib/plausible_web/controllers/api/stats_controller.ex
  +++ lib/plausible_web/controllers/api/stats_controller.ex
  -        meta: Map.merge(meta, Stats.Breakdown.formatted_date_ranges(query)),
  +        meta:
  +          meta.values
  +          |> Map.new()
  +          |> Map.merge(Stats.Breakdown.formatted_date_ranges(query)),

  --- test/plausible_web/controllers/api/stats_controller/pages_test.exs
  +++ test/plausible_web/controllers/api/stats_controller/pages_test.exs
  +      assert json_response(conn, 200)["meta"]["date_range_label"] == "2 Jan 2021"
  +      assert json_response(conn, 200)["meta"]["comparison_date_range_label"] == "1 Jan 2021"
Fable 5 (fail)
  --- lib/plausible/stats/breakdown.ex
  +++ lib/plausible/stats/breakdown.ex
       %{
         results: build_breakdown_result(results, query_with_metrics, metrics),
  -      meta: meta
  +      # `meta` is a `Jason.OrderedObject` - convert it to a plain map so that
  +      # callers can safely `Map.merge/2` extra fields into it. Merging into the
  +      # struct would add keys outside of its `values` field, which the JSON
  +      # encoder for `Jason.OrderedObject` silently ignores.
  +      meta: Map.new(meta.values)
       }

  --- lib/plausible_web/controllers/api/external_stats_controller.ex
  +++ lib/plausible_web/controllers/api/external_stats_controller.ex
  -  defp maybe_add_warning(payload, %Jason.OrderedObject{} = meta) do
  +  defp maybe_add_warning(payload, meta) do

  --- test/plausible_web/controllers/api/stats_controller/pages_test.exs
  +++ test/plausible_web/controllers/api/stats_controller/pages_test.exs
  +      assert json_response(conn, 200)["meta"] == %{
  +               "date_range_label" => "2 Jan 2021",
  +               "comparison_date_range_label" => "1 Jan 2021"
  +             }
I'm not an Elixir programmer, nor am I familiar with this codebase, but just looking at the code, the failing, "non-tasteful" Opus 4.7 solution looks semantically identical to the reference solution. The only difference is that the pipeline was expanded onto multiple lines for readability. Without knowing Elixir, it strikes me as absurd to fail this based on "tastefulness".
I've used other languages where you commonly use a pipe operator like this (such as F# or R with tidyverse) and I don't believe I've ever run into anyone who would reject the Opus 4.7 change for being "untasteful" (unless there was a style guide which had strict rules about what should be expanded into multiple lines and what shouldn't, but if that were the case, an autoformatter should deal with this and the formatting of the solution is irrelevant).
The Fable 5 solution should arguably be rejected for expanding the scope of the change too much but, whether or not it should be rejected for other reasons, it seems wrong to additionally reject it as "untasteful" due to the length.
Grader variance
LLM variance also applies to the grading itself. Of course it must be the case that if we feed the results of one single run to an LLM grader multiple times, we'll get different scores for the same reason we often get wildly different results when we ask an LLM to solve the same problem multiple times. I tried having my friendly neighborhood coding agent re-run grading 10 times for each condition that GPT-5.6 Sol and Opus 4.8 were tested under (codex tells me grading was run using Sonnet 4.6, so it re-ran with that). The expected LLM-graded tastefulness result flips from the official result 23% of the time when using the same model and effort level (in terms of sub-results, relative taste flips in 32% of cases, practice alignment flips in 5% of cases, and task rubric flips in 3% of cases). If we instead look at the fraction of the time the official result differed from the typical/median result, there's a 21% difference overall (27% for relative taste, 3% for practice alignment, and 2% for task rubric). The overall flip rate is lower than the individual flip rate because, in some cases, a result flipped from tasteful to untasteful in a sub-score when the overall score was already untasteful.
Just to be clear, this is not run-to-run variance. This is the variance from using LLM grading on a single run, which, across the publicly available GPT-5.6 Sol and Opus 4.8 benchmarks, appears to give an incorrect result about 20% of the time (if we assume what's being measured is correct and reasonable to measure in the first place and tha the most likely Sonnet score is the correct score).
Of course we get different results if we grade with different models as well. If we re-grade with GPT-5.6 Sol instead of Sonnet 4.6, the number of solutions that are judged to be tasteful is cut by more than half for both models. Is that more or less accurate? Who knows?
Taste oracle
The issues described above would be a problem even if LLMs were good enough to, in general, make a judgement call on code quality. In addition to Senior SWE-Bench being structurally flawed, it's also flawed because it's pointless to attempt to judge code quality with SOTA LLMs today, let alone Sonnet 4.6. As we previously noted, when we have a problem we don't have a good numerical angle on, it's often better to avoid making up a fake number than to assign a meaningless number, which is what we get today if we have an LLM try to judge code quality.
Overall validity
Sometimes, you can look at a benchmark and say that, while some individual results are wrong, in aggregate, the noise cancels out and the overall results make sense. I don't think that's the case here. I've seen a lot of people passing Senior SWE-Bench around, seemingly because it purports to give realistic problems and score them in a reasonable way. We already noted that, prima facie, the results don't seem plausible, and, that looking at the methodology supports the prima facie thought that the result is not meaningful3.
The presentation of results also leaves something to be desired. On a Slack I'm on, someone linked to this, which shows a preview snippet with the following:
- Claude Fable 5: 29.1%
- Claude Opus 4.8: 25.0%
- GPT-5.6 Sol: 24.4%
They gave an approving comment, saying this was more realistic than other benchmarks (referring to one of the many benchmarks that put GPT-5.5 ahead of Opus 4.8). If you actually look at the results, it's clear that the difference between 25.0% and 24.4% is pretty much meaningless, but the results are presented as if these are meaningful differences. Although the page makes it clear that GPT-5.6 Sol is, as measured, much cheaper than Opus 4.8, most discussions I've seen that refer to Senior SWE-Bench elide this and mention only the headline result. It also seems odd that the headline result uses max for Fable, Opus, and Sonnet, but xhigh for GPT-5.6, GPT-5.5, and GPT-5.4.
31. Cold weather tire performance
Although people commonly say that all-season tires become so hard (for some reason, the phrasing that they become as hard as "hockey pucks" is common) at 7C / 45F that they're unsafe, there's no benchmark! This has been a common theme in this series: people repeating a claim that has no apparent basis in a measurement4.
Luckily, as we discussed in this post on platforms and monetization, Jonathan Benson has been able to monetize in-depth explorations on tires, resulting in a never-before seen level of detail in public tire benchmarks. He tested how well different kinds of tires perform at different temperatures and in different conditions. I'm sure tire manufacturers have all sorts of tests like this but, AFAIK, this hadn't been done publicly in a comprehensive way before (hmm, this doesn't seem so different from public benchmarks of coding agents).
In Benson's testing, he finds that, in dry conditions, summer tires have the best grip down to 0C / 32 F (he didn't test colder conditions), followed by all-seasons, with winter being worse than both summer tires and all-seasons by a fairly large margin. In wet conditions, he only tested down to 2C since, at 0C, you have icy conditions and not just wet conditions. The ranking is a bit different since all-season tires wildly outperformed summer tires at 2C in the wet, but summer tires still outperformed winter tires.
Note that, in the video, what Benson calls a winter tire is a UHP winter tire, which I very rarely see people using in the US or Canada (although it's what I use for a winter tire since that makes sense for the local conditions where I live). As weirdo who looks at what tires people are running, except on my car, I've only seen people running UHP winter tires locally when they have a high-performance care where the OEM recommended option is a UHP winter tire (and even then, they won't be running a UHP winter tire most of the time when they have a winter tire).
What he calls a "nordic" tire is what most people use for a winter tire even locally here and everywhere else I've lived, all of which are locations where that kind of tire doesn't really make sense unless you're spending a lot of time driving into the mountains (and even then, it's probably still not the right choice for most people where I've lived) or you spend a lot of time driving on ice because performance in dry and wet codnitions is dramatically worse than a UHP winter tire; locally, where I live, ice is extremely rare in the city (I've never encountered it at street speeds in more than half a decade) and someone who who mostly drives in the city is mostly driving in dry and wet conditions with occasional snow, where a "nordic" (standard) winter tire is the worst tire you could run other than a specialist tire like a track tire or an all-terrain tire. And if you look at the UHP winter tire results compared to all-seasons, it's still true that all-seasons are better in dry or wet conditions above 0C, although the magnitude of the difference is much smaller than it is relative to the "nordic" winter tires that most people in the US use (I think the terminology he's using might be more common in Europe?).
Of course different tires will perform differently and we'd see some variation in results with different tires, and of course there are many conditions where it's better to have winter tires than all-season tires or summer tires, but the idea that all-season tires become too hard to grip and you have to have winter tires for cold alone is clearly false at commonly cited temperatures.
Who cares about tires?
BTW, if you're wondering why you should care about tires at all, on average, motor vehicle accidents are a fairly major cause of death and, if you look at the impact of velocity on accident severity, it's pretty significant, so it stands to reason that having tires that let you brake more rapidly or corner a little better and maybe avoid or deflect the accident a bit, it's reasonable to think this would have a substantial impact on accident severity. I don't think this is the kind of thing there's really good data for (it would be very hard to run the randomized trial and observational data is going to be highly confounded, in general).

But, as part of an analysis I did last year, I tried to find the relationship between HIC and velocity in actual crash test data. Surprisingly to me, I couldn't find a paper that had done this (I did find some papers that could serve as exercises for this series, though), but a straightforward analysis put the relationship as roughly to the fourth power. I should really write that up into a post that's like this other post on crash testing, but specifically about the HIC and concussion risk of various vehicles! Anyway, I try to drive a car with the right tires for the locale because it seems like that's plausibly one of the higher impact interventions I could do for my own safety per dollar and/or effort. But I've never gotten close to a situation where my really good tires have made a difference and someone who's going to try to find the right tires for safety reasons may be less likely to get into an accident in the first place, so this may just be a silly hobby that doesn't matter at all.
More problems in benchmarking and evals
If you liked this post. this is part of a series of exercises on benchmarking, evals, and experimental design (1, 2, 3, 4, 5, 6)5.
Thanks to Peter Geoghegan, Aaron Levin, Luke Burton, Em Chu, Jamie Brandon, Yossi Kreinin, Jeshua Smith, and Ikhwan Lee, for comments/corrections/discussion.
Appendix: more on disk performance
Here are some follow-up comments by Peter Geoghegan who, unlike me, actually knows something about disk performance:
I've seen significant variation in performance across more or less comparable SSDs for certain access patterns. This is likely due to FTL/firmware level differences. Evidently some SSDs are much better than others at reading backwards sequentially, independent of OS read ahead (with direct IO). Here's a blog post about it from the person I'm working with on IO prefetching for index scans in Postgres: https://vondra.me/posts/fun-and-weirdness-with-ssds.
I'm fairly sure that these things are still opaque to the OS/filesystem. This admittedly-dated LWN.net article provides some justification for this: https://lwn.net/Articles/353411, "The message to file systems developers is "Just trust us" and "Don't worry your pretty little systems programmers' heads about it" whenever we ask for more information on SSD implementation".
I asked Linux hacker Matthew Wilcox about this in 2023. He said that it was about the same, and that if I wanted to account for performance variation for microbenchmarking purposes the best way was still to be very defensive about provisioning, running TRIM regularly, etc.
At one point (I think around 2015), I wrote some code with the intention of turning it into some exercises or a tutorial on CPU performance. It was sort of like the napkin math repo, but much narrower. The idea was that you could have questions like:
- You have CPU X. If you want to know how fast this loop is, what parameters do you need to know?
- Given these parameters, how fast should the loop be?
I had the code I wanted for various things but, for some reason, the code I wrote didn't elicit a difference between a DRAM open page access and a closed page access and then I got distracted with other things and didn't end up writing it up. Pre-LLM, doing this kind of thing was fairly time consuming, because to get it right, you have to know enough about what the mechanisms that are in play are and then take some care in writing the code and checking what it does. And then, because I screwed something up and make enough time to debug it, I never ended up writing up the exercises because I didn't want to write it up when there was some kind of mystery that implied that my code had at least one issue.
Anyway, disk is way more complicated and getting good numbers would take a lot more care. With LLMs, I think this would now be doable without it taking a ton of time, but some care would still be necessary.
P.S. The friend of mine mentioned in (29) is Jamie Brandon, who's actively interviewing and looking for work. He's done a fair amount of work on databases (query engines) and streaming systems. His best-known writing is probably Against SQL, but he's also written quite a few other posts I like, such as this analysis of streaming systems consistency bugs. He's mainly looking for a Vancouver-local job or a remote job. If you'd like to talk to him, you can reach him at jamie@scattered-thoughts.net.
- I'm often mistaken for a performance engineer, but I think it's more like, I sometimes solve performance problems due to a combination of having an unusual degree of experience with benchmarking / evals / experimental design for a programmer due to my hardware background (where this is a more mature field than it is in software, as discussed here) and my propensity to go after problems that can easily be linked to dollar value such as this, or this, but I'm as likely to solve a performance problem as any other problem and I don't have a particularly deep or broad knowledge of performance problems compared to people who do performance work day in and day out. [return]
- On the topic of whether or not it makes sense to filter by language, I looked into this after seeing people cite this post about token efficiency of languages; the results from that post didn't replicate for non-trivial tasks, but there seemed to be real enough differences between languages that it plausibly made sense to filter by language. In particular, when agents fail to implement something, especially on lower effort levels, it's often due to some idiosyncratic incorrect usage of a language. For example, for the zstd eval in that post, agents using Clojure would very often rely in incorrect semantics of byte conversion, but agents using Java, which fundamentally has the same operations available, wouldn't make that mistake. [return]
At a meta level, people who I talk to who generally have comments I find reasonable on other topics don't take these headline/summary results very seriously.
For example, In a comment on the usefulness of these benchmarks, Em Chu said:
twitter/hacker news sentiment, which at least won't be misleadingly precise, feels like a better way to tell whether or not a model is useful, as strange as that is (which unfortunately requires reading a lot of hacker news posts, so I cannot recommend.) I usually find my eyes skipping over anything that looks like an LLM benchmark since the chances that it's worth reading are near zero. (I wish I would do this for hacker news comments too.)
Most people I know whose judgment I trust take a similar approach (sometimes substituting opinions of people they know for online sentiment). The exceptions to this are generally people who work in the field and look at a ton of benchmarks and do some kind of mental aggregation of them. For example, when I talk to Max Bitker (who runs an RL environment startup), he's familiar with seemingly every public benchmark and can seem to predict what sentiment will be like a couple weeks after a model release based on his mental model of the aggregate landscape of all the benchmarks out there, but that's a very different thing than looking at a summary score metric and time-consuming enough that, unless you work on AI, this seems more like a hobby interest than something you'd reasonably do to evaluate model effectiveness (nothing against hobby interests; I have lots of hobby interests).
For a concrete example of what it looks like to take the results of these benchmarks seriously vs. what's observed in the real world, here's a thread where someone creates an effectiveness vs. cost table of the then-new 5.6 Sol/Terra/Luna vs. 5.5 using DeepSWE results. Someone (who I'd agree with, although I'd phrase it differently) replies
Bullshit. Have you actually used the models or are you having a wank? According to this table 5.6-sol xhigh would be both cheaper and better than 5.5 xhigh. In what reality is that actually true?
Another person replies to them with
In none. I think the benchmark tasks are really straighforward in which case the table may be true.
I don't think that's quite fair (I've tried tasks where it seems to be true) but, in general, people mostly have very different experiences than public benchmarks are showing. This seems to be understood by quite a few people, from people I know in person to random internet commenters. But it's not universal, as I still see people passing around these scores to explain why they use some model and effort level, which doesn't seem justified in general.
[return]- In general, I don't turn these examples into an exercise unless it's a common claim that I see many times because completely unsupported incorrect claims happen so frequently that it's not really interesting in the general case. [return]
I've been publishing these on Patreon without a strong reason to. I make a bit of money off Patreon, but if I was optimizing for money I think it would obviously be the right choice to just publish everything publicly since the potential delta in earnings from maybe getting connected to a potential job dwarfs what I could earn directly via Patreon. That goes double considering how bad I am at interviews (I've almost exclusively gotten jobs where the interview is formality as my odds of passing an interview are otherwise close to zero; the last time I did an interview, I failed a phone screen on a leetcode-style question, and when I pass those I'll typically fail the full interview later if it's a real interview).
I originally started publishing things on Patreon that I thought were too small or inconsequential to turn into a "real" blog post, but then I got in the habit of publishing things on Patreon and haven't written much publicly for a while.
This kind of post, which is part of a long set of exercises, falls squarely into the category of things that seems too small and inconsequential to put onto the main blog. If you have opinions on this, I'd be curious to hear what you think.
The idea behind this series was that I wanted to write some kind of tutorial or blog post to help people with better benchmarking and evals. But, my feeling on evals is that it's more about avoiding mistakes than following some particular process, so there isn't really a step-by-step guide format that works in the general case. I know there are approaches to experimental design where they teach you to do things like drawing a causal graph and then looking at the graph to figure out the potential problems, e.g., collider bias. Just from seeing how people do data analysis before and after learning techniques like this, I don't think this makes a huge difference on average (although a few people do find it very useful).
I saw a criticism of this as a generalized way to avoid experimental design issues somewhere (maybe from Andrew Gelman) that the problem is that everything is related to everything, so you're still applying your judgement when you create the causal graph. Being able to mechanically see the problems once the graph is created doesn't stop someone from drawing the wrong graph in the first place.
A vaguely related idea that I saw when I read the first chunk of McElreath's Statistical Rethinking many years ago, hoping to learn some process that would lead to rigorous statistical analysis is that there isn't really such a process and you ultimately have to use your judgement to decide if something makes sense or not.
That being the case, I thought a series of exercises might work, so I had this idea to write maybe 50 or 100 exercises into a single post. That seems quite do-able for small exercises, but it's clear from watching people learn a variety of things that giving people a bunch of small exercises and then hoping that people generalize the techniques onto larger, more complex, exercises, doesn't usually work very well. Once you start adding in larger, more complex, exercises, you quickly get beyond the length of a long post, even by the standards of this blog, which has this 32k word post on what the FTC got wrong in their 2011-2012 investigation of Google (for reference, a typical novel is often said to be 80k-100k words).
In general, I've avoided putting multi-part posts on the blog because, as a reader, I much prefer it if things are all in one post instead of spread across some kind of long series of posts. I get that authors often prefer multi-part posts because it generally results in more traffic, better odds of a post going viral on social media, etc., but I've always optimized this blog to be more like what I want to read than to maximize page views. In this case, it seems like the single-post version could easily be as long as a doorstop fantasy novel (for reference, Brandon Sanderson's Stormlight Archive books are said to be around 450k words), compared to this post with 3 exercises and maybe 7k words. I suppose I need 64 posts at that rate, and I'm only on 7, but there are certainly enough problems out there to write up 64 posts and it's just a question of making time for them.
[return]