This is an excerpt from an internal document David Mackey and I co-authored in April 2019. The document is excerpted since much of the original doc was about comparing possible approaches to increasing efficency at Twitter, which is mostly information that's meaningless outside of Twitter without a large amount of additional explanation/context.
At Twitter, most CPU bound services start falling over at around 50% reserved container CPU utilization and almost all services start falling over at not much more CPU utilization even though CPU bound services should, theoretically, be able to get higher CPU utilizations. Because load isn't, in general, evenly balanced across shards and the shard-level degradation in performance is so severe when we exceed 50% CPU utilization, this makes the practical limit much lower than 50% even during peak load events.
This document will describe potential solutions to this problem. We'll start with describing why we should expect this problem given how services are configured and how the Linux scheduler we're using works. We'll then look into case studies on how we can fix this with config tuning for specific services, which can result in a 1.5x to 2x increase in capacity, which can translate into $[redacted]M/yr to $[redacted]M/yr in savings for large services. While this is worth doing and we might get back $[redacted]M/yr to $[redacted]M/yr in TCO by doing this for large services, manually fixing services one at a time isn't really scalable, so we'll also look at how we can make changes that can recapture some of the value for most services.
The problem, in theory
Almost all services at Twitter run on Linux with the CFS scheduler, using CFS bandwidth control quota for isolation, with default parameters. The intention is to allow different services to be colocated on the same boxes without having one service's runaway CPU usage impact other services and to prevent services on empty boxes from taking all of the CPU on the box, resulting in unpredictable performance, which service owners found difficult to reason about before we enabled quotas. The quota mechanism limits the amortized CPU usage of each container, but it doesn't limit how many cores the job can use at any given moment. Instead, if a job "wants to" use more than that many cores over a quota timeslice, it will use more cores than its quota for a short period of time and then get throttled, i.e., basically get put to sleep, in order to keep its amortized core usage below the quota, which is disastrous for tail latency.
Since the vast majority of services at Twitter use thread pools that are much larger than their mesos core reservation, when jobs have heavy load, they end up requesting and then using more cores than their reservation and then throttling. This causes services that are provisioned based on load test numbers or observed latency under load to over provision CPU to avoid violating their SLOs. They either have to ask for more CPUs per shard than they actually need or they have to increase the number of shards they use.
An old example of this problem was the JVM Garbage Collector. Prior to work on the JVM to make the JVM container aware, each JVM would default the GC parallel thread pool size to the number of cores on the machine. During a GC, all these GC threads would run simultaneously, exhausting the cpu quota rapidly causing throttling. The resulting effect would be that a subsecond stop-the-world GC pause could take many seconds of wallclock time to complete. While the GC issue has been fixed, the issue still exists at the application level for virtually all services that run on mesos.
The problem, in practice [case study]
As a case study, let's look at service-1, the largest and most expensive service at Twitter.
Below is the CPU utilization histogram for this service just as it starts failing its load test, i.e., when it's just above the peak load the service can handle before it violates its SLO. The x-axis is the number of CPUs used at a given point in time and the y-axis is (relative) time spent at that utilization. The service is provisioned for 20 cores and we can see that the utilization is mostly significantly under that, even when running at nearly peak possible load:
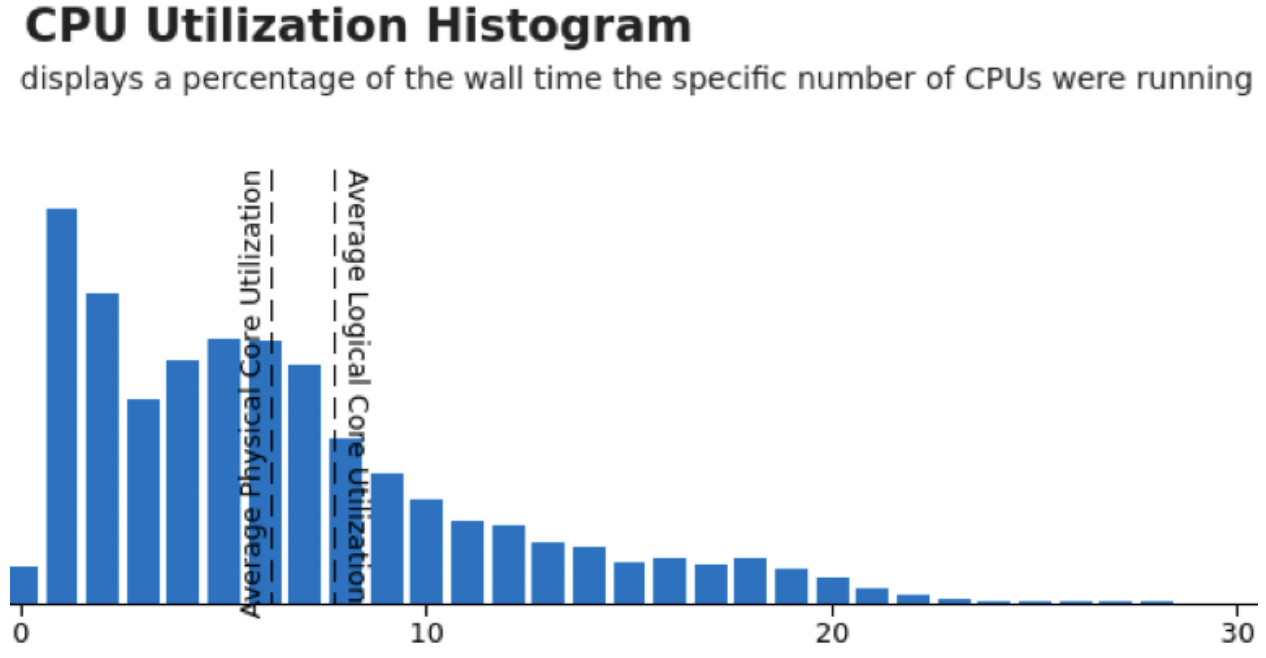
The problem is the little bars above 20. These spikes caused the job to use up its CPU quota and then get throttled, which caused latency to drastically increase, which is why the SLO was violated even though average utilization is about 8 cores, or 40% of quota. One thing to note is that the sampling period for this graph was 10ms and the quota period is 100ms, so it's technically possible to see an excursion above 20 in this graph without throttling, but on average, if we see a lot of excursions, especially way above 20, we'll likely get throttling.
After reducing the thread pool sizes to avoid using too many cores and then throttling, we got the following CPU utilization histogram under a load test:
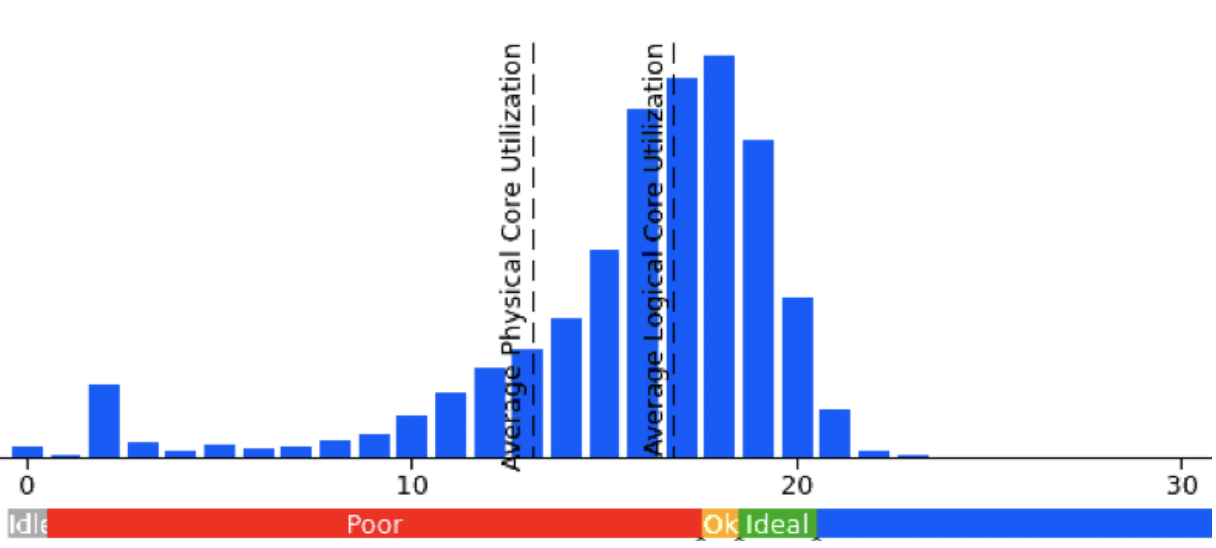
This is at 1.6x the load (request rate) of the previous histogram. In that case, the load test harness was unable to increase load enough to determine peak load for service-1 because the service was able to handle so much load before failure that the service that's feeding it during the load test couldn't keep it and send more load (although that's fixable, I didn't have the proper permissions to quickly fix it). [later testing showed that the service was able to handle about 2x the capacity after tweaking the thread pool sizes]
This case study isn't an isolated example — Andy Wilcox has looked at the same thing for service-2 and found similar gains in performance under load for similar reasons.
For services that are concerned about latency, we can get significant latency gains if we prefer to get latency gains instead of cost reduction. For service-1, if we leave the provisioned capacity the same instead of cutting by 2x, we see a 20% reduction in latency.
The gains for doing this for individual large services are significant (in the case of service-1, it's [mid 7 figures per year] for the service and [low 8 figures per year] including services that are clones of it, but tuning every service by hand isn't scalable. That raises the question: how many services are impacted?
Thread usage across the fleet
If we look at the number of active threads vs. number of reserved cores for moderate sized services (>= 100 shards), we see that almost all services have many more threads that want to execute than reserved cores. It's not uncommon to see tens of runnable threads per reserved core. This makes the service-1 example, above, look relatively tame, at 1.5 to 2 runnable threads per reserved core under load.
If we look at where these threads are coming from, it's common to see that a program has multiple thread pools where each thread pool is sized to either twice the number of reserved cores or twice the number of logical cores on the host machine. Both inside and outside of Twitter, It's common to see advice that thread pool size should be 2x the number of logical cores on the machine. This advice probably comes from a workload like picking how many threads to use for something like a gcc compile, where we don't want to have idle resources when we could have something to do. Since threads will sometimes get blocked and have nothing to do, going to 2x can increase throughput over 1x by decreasing the odds that any core is every idle, and 2x is a nice, round, number.
However, there are a few problems with applying this to Twitter applications:
- Most applications have multiple, competing, thread pools
- Exceeding the reserved core limit is extremely bad
- Having extra threads working on computations can increase latency
The "we should provision 2x the number of logical cores" model assumes that we have only one main thread pool doing all of the work and that there's little to no downside to having threads that could do work sit and do nothing and that we have a throughput oriented workload where we don't care about the deadline of any particular unit of work.
With the CFS scheduler, threads that have active work that are above the core reservation won't do nothing, they'll get scheduled and run, but this will cause throttling, which negatively impacts tail latency.
Potential Solutions
Given that we see something similar looking to our case study on many services and that it's difficult to push performance fixes to a lot of services (because service owners aren't really incentivized to take performance improvements), what can we do to address this problem across the fleet and just on a few handpicked large services? We're going to look at a list of potential solutions and then discuss each one in more detail, below.
- Better defaults for cross-fleet threadpools (eventbus, netty, etc.)
- Negotiating ThreadPool sizes via a shared library
- CFS period tuning
- CFS bandwidth slice tuning
- Other scheduler tunings
- CPU pinning and isolation
- Overprovision at the mesos scheduler level
Better defaults for cross-fleet threadpools
Potential impact: some small gains in efficiency
Advantages: much less work than any comprehensive solution, can be done in parallel with more comprehensive solutions and will still yield some benefit (due to reduced lock contention and context switches) if other solutions are in place.
Downsides: doesn't solve most of the problem.
Many defaults are too large. Netty default threadpool size is 2x the reserved cores. In some parts of [an org], they use a library that spins up eventbus and allocates a threadpool that's 2x the number of logical cores on the host (resulting in [over 100] eventbus threads) when 1-2 threads is sufficient for most of their eventbus use cases.
Adjusting these default sizes won't fix the problem, but it will reduce the impact of the problem and this should be much less work than the solutions below, so this can be done while we work on a more comprehensive solution.
Negotiating ThreadPool sizes via a shared library (API)
[this section was written by Vladimir Kostyukov]
Potential impact: can mostly mitigate the problem for most services.
Advantages: quite straightforward to design and implement; possible to make it first-class in Finagle/Finatra.
Downsides: Requires service-owners to opt-in explicitly (adopt a new API for constructing thread-pools).
CSL’s util library has a package that bridges in some integration points between an application and a JVM (util-jvm), which could be a good place to host a new API for negotiating the sizes of the thread pools required by the application.
The look and feel of such API is effectively dictated by how granular the negotiation is needed to be. Simply contending on a total number of allowed threads allocated per process, while being easy to implement, doesn’t allow distinguishing between application and IO threads. Introducing a notion of QoS for threads in the thread pool (i.e., “IO thread; can not block”, “App thread; can block”), on the other hand, could make the negotiation fine grained.
CFS Period Tuning
Potential impact: small reduction tail latencies by shrinking the length of the time period before the process group’s CFS runtime quota is refreshed.
Advantages: relatively straightforward change requiring few minimal changes.
Downsides: comes at increased scheduler overhead costs that may offset the benefits and does not address the core issue of parallelism exhausting quota. May result in more total throttling.
To limit CPU usage, CFS operates over a time window known as the CFS period. Processes in a scheduling group take time from the CFS quota assigned to the cgroup and this quota is consumed over the cfs_period_us in CFS bandwidth slices. By shrinking the CFS period, the worst case time between quota exhaustion causing throttling and the process group being able to run again is reduced proportionately. Taking the default values of a CFS bandwidth slice of 5ms and CFS period of 100ms, in the worst case, a highly parallel application could exhaust all of its quota in the first bandwidth slice leaving 95ms of throttled time before any thread could be scheduled again.
It's possible that total throttling would increase because the scheduled time over 100ms might not exceed the threshold even though there are (for example) 5ms bursts that exceed the threshold.
CFS Bandwidth Slice Tuning
Potential impact: small reduction in tail latencies by allowing applications to make better use of the allocated quota.
Advantages: relatively straightforward change requiring minimal code changes.
Downsides: comes at increased scheduler overhead costs that may offset the benefits and does not address the core issue of parallelism exhausting quota.
When CFS goes to schedule a process it will transfer run-time between a global pool and CPU local pool to reduce global accounting pressure on large systems.The amount transferred each time is called the "slice". A larger bandwidth slice is more efficient from the scheduler’s perspective but a smaller bandwidth slice allows for more fine grained execution. In debugging issues in [link to internal JIRA ticket] it was determined that if a scheduled process fails to consume its entire bandwidth slice, the default slice size being 5ms, because it has completed execution or blocked on another process, this time is lost to the process group reducing its ability to consume all available resources it has requested.
The overhead of tuning this value is expected to be minimal, but should be measured. Additionally, it is likely not a one size fits all tunable, but exposing this to the user as a tunable has been rejected in the past in Mesos. Determining a heuristic for tuning this value and providing a per application way to set it may prove infeasible.
Other Scheduler Tunings
Potential Impact: small reduction in tail latencies and reduced throttling.
Advantages: relatively straightforward change requiring minimal code changes.
Downsides: comes at potentially increased scheduler overhead costs that may offset the benefits and does not address the core issue of parallelism exhausting quota.
The kernel has numerous auto-scaling and auto-grouping features whose impact to scheduling performance and throttling is currently unknown. kernel.sched_tunable_scaling can adjust kernel.sched_latency_ns underneath our understanding of its value. kernel.sched_min_granularity_ns and kernel.sched_wakeup_granularity_ns can be tuned to allow for preempting sooner, allowing better resource sharing and minimizing delays. kernel.sched_autogroup_enabled may currently not respect kernel.sched_latency_nsleading to more throttling challenges and scheduling inefficiencies. These tunables have not been investigated significantly and the impact of tuning them is unknown.
CFS Scheduler Improvements
Potential impact: better overall cpu resource utilization and minimized throttling due to CFS inefficiencies.
Advantages: improvements are transparent to userspace.
Downsides: the CFS scheduler is complex so there is a large risk to the success of the changes and upstream reception to certain types of modifications may be challenging.
How the CFS scheduler deals with unused slack time from the CFS bandwidth slice has shown to be ineffective. The kernel team has a patch to ensure that this unused time is returned back to the global pool for other processes to use, https://lore.kernel.org/patchwork/patch/907450/ to ensure better overall system resource utilization. There are some additional avenues to explore that could provide further enhancements. Another of many recent discussions in this area that fell out of a k8s throttling issue(https://github.com/kubernetes/kubernetes/issues/67577) is https://lkml.org/lkml/2019/3/18/706.
Additionally, CFS may lose efficiency due to bugs such as [link to internal JIRA ticket] and http://www.ece.ubc.ca/~sasha/papers/eurosys16-final29.pdf. However, we haven't spent much time looking at the CFS performance for Twitter’s particular use cases. A closer look at CFS may find ways to improve efficiency.
Another change which has more upside and downside potential would be to use a scheduler other than CFS.
CPU Pinning and Isolation
Potential impact: removes the concept of throttling from the system by making the application developer’s mental model of a CPU map to a physical one.
Advantages: simplified understanding from application developer’s perspective, scheduler imposed throttling is no longer a concept an application contends with, improved cache efficiency, much less resource interference resulting in more deterministic performance.
Disadvantages: greater operational complexity, oversubscription is much more complicated, significant changes to current operating environment
The fundamental issue that allows throttling to occur is that a heavily threaded application can have more threads executing in parallel than the “number of CPUs” it requested resulting in an early exhaustion of available runtime. By restricting the number of threads executing simultaneously to the number of CPUs an application requested there is now a 1:1 mapping and an application’s process group is free to consume the logical CPU thread unimpeded by the scheduler. Additionally, by dedicating a CPU thread rather than a bandwidth slice to the application, the application is now able to take full advantage of CPU caching benefits without having to contend with other applications being scheduled on the same CPU thread while it is throttled or context switched away.
In Mesos, implementing CPU pinning has proven to be quite difficult. However, in k8s there is existing hope in the form of a project from Intel known as the k8s CPU Manager. The CPU Manager was added as an alpha feature to k8s in 1.8 and has been enabled as a beta feature since 1.10. It has somewhat stalled in beta as few people seem to be using it but the core functionality is present. The performance improvements promoted by the CPU Manager project are significant as shown in examples such as https://kubernetes.io/blog/2018/07/24/feature-highlight-cpu-manager/ and https://builders.intel.com/docs/networkbuilders/cpu-pin-and-isolation-in-kubernetes-app-note.pdf While these benchmarks should be looked at with some skepticism, it does provide promising hope for exploring this avenue. A cursory inspection of the project highlights a few areas where work may still be needed but it is already in a usable state for validating the approach. Underneath, the k8s CPU Manager leverages the cpuset cgroup functionality that is present in the kernel.
Potentially, this approach does reduce the ability to oversubscribe the machines. However, the efficiency gains from minimized cross-pod interference, CPU throttling, a more deterministic execution profile and more may offset the need to oversubscribe. Currently, the k8s CPU Manager does allow for minor oversubscription in the form of allowing system level containers and the daemonset to be oversubscribed, but on a pod scheduling basis the cpus are reserved for that pod’s use.
Experiments by Brian Martin and others have shown significant performance benefits from CPU pinning that are almost as large as our oversubscription factor.
Longer term, oversubscription could be possible through a multitiered approach of wherein a primary class of pods is scheduled using CPU pinning but a secondary class of pods that is not as latency sensitive is allowed to float across all cores consuming slack resources from the primary pods. The work on the CPU Manager side would be extensive. However, recently Facebook has been doing some work on the kernel scheduler side to further enable this concept in a way that minimally impacts the primary pod class that we can expand upon or evolve.
Oversubscription at the cluster scheduler level
Potential impact: can bring machine utilization up to an arbitrarily high level and overprovisioning "enough".
Advantages: oversubscription at the cluster scheduler level is independent of the problem described in this doc; doing it in a data-driven way can drive machine utilization up without having to try to fix the specific problems described here. This could simultaneously fix the problem in this doc (low CPU utilization due to overprovisioning to avoid throttling) while also fixing [reference to document describing another problem].
Disadvantages: we saw in [link to internal doc] that shards of services running on hosts with high load have degraded performance. Unless we change the mesos scheduler to schedule based on actual utilization (as opposed to reservation), some hosts would end up too highly loaded and services with shards that land on those hosts would have poor performance.
Disable CFS quotas
Potential impact: prevents throttling and allows services to use all available cores on a box by relying on the "shares" mechanism instead of quota.
Advantages: in some sense, can gives us the highest possible utilization.
Disadvantages: badly behaved services could severely interfere with other services running on the same box. Also, service owners would have a much more difficult time predicting the performance of their own service since performance variability between the unloaded and loaded state would be much larger.
This solution is what was used before we enabled quotas. From a naive hardware utilization standpoint, relying on the shares mechanism seems optimal since this means that, if the box is underutilized, services can take unused cores, but if the box becomes highly utilized, services will fall back to taking their share of cores, proportional to their core reseration. However, when we used this system, most service owners found it too difficult to estimate performance under load for this to be practical. At least one company has tried this solution to fix their throttling problem and has had severe incidents under load because of it. If we switched back to this today, we'd be no better off than we were before we were before we enabled quotes.
Given how we allocate capacity, two ingredients that would make this work better than it did before include having a more carefully controlled request rate to individual shards and a load testing setup that allowed service owners to understand what things would really look like during a load spike, as opposed to our system, which only allows injection of unrealistic load to individual shards, which both has the problem that the request mix isn't the same as it is under a real load spike and that the shard with injected load isn't seeing elevated load from other services running on the same box. Per [another internal document], we know that one of the largest factors impacting shard-level performance is overall load on the box and that the impact on latency is non-linear and difficult to predict, so there's not really a good way to predict performance under actual load from performance under load tests with the load testing framework we have today.
Although these missing ingredients are important, high impact, issues, addressing either of these issues is beyond the scope of this doc; [Team X] owns load testing and is working on load testing and it might be worth revisiting this when the problem is solved.
An intermediate solution would be to set the scheduler quota to a larger value than the number of reserved cores in mesos, which would bound the impact of having "too much" CPU available causing unpredictable performance while potentially reducing throttling when under high load because the scheduler will effective fall back to the shares mechanism if the box is highly loaded. For example, if the cgroup quota was twice the the mesos quota, services that fall over at 50% of reserved mesos CPU usage would then instead fall over at 100% of reserved mesos CPU usage. For boxes at high load, the higher overall utilization would reduce throttling because the increased load from other cores would mean that a service that has too many runnable threads wouldn't be able to have as many of those threads execute. This has a weaker version of the downside of disabling in quota, in that, from [internal doc], we know that load on a box from other services is one of the largest factors in shard-level performance variance and this would, if we don't change how many mesos cores are reserved on a box, increase load on boxes. And if we do proportionately decrease the number of mesos reserved cores on a box, that makes the change pointless in that it's equivalent to just doubling every service's CPU reservation, except that having it "secretly" doubled would probably reduce the number of people who ask the question, "Why can't I exceed X% CPU in load testing without the service falling over?"
Results
This section was not in the original document from April 2019; it was written in December 2021 and describes work that happened as a result of the original document.
The suggestion of changing default thread pool sizes was taken and resulted in minor improvements. More importantly, two major efforts came out of the document. Vladimir Kostyukov (from the CSL team) and Flavio Brasil (from the JVM team) created Finagle Offload Filter and Xi Yang (my intern at the time and now a full-time employee for my team) created a kernel patch which eliminates container throttling (the patch is still internal, but will hopefully eventually upstreamed).
Almost all applications that run on mesos at Twitter run on top of Finagle. The Finagle Offload Filter makes it trivial for service owners to put application work onto a different thread pool than IO (which was often not previously happening). In combination with sizing thread pools properly, this resulted in, ceteris paribus, applications having drastically reduced latency, enabling them to reduce their provisioned capacity and therefore their cost while meeting their SLO. Depending on the service, this resulted in a 15% to 60% cost reduction for the service.
The kernel patch implements the obvious idea of preventing containers from using more cores than a container's quota at every moment instead of allowing a container to use as many cores as are available on the machine and then putting the container to sleep if it uses too many cores to bring its amortized core usage down.
In experiments on hosts running major services at Twitter, this has the expected impact of eliminating issues related to throttling, giving a roughly 50% cost reduction for a typical service with untuned thread pool sizes. And it turns out the net impact is larger than we realized when we wrote this document due to the reduction in interference caused by preventing services from using "too many" cores and then throttling. Also, although this was realized at the time, we didn't note in the document that the throttling issue causes shards to go from "basically totally fine" to a "throttling death spiral" that's analogous to a "GC death spiral" with only a small amount of additional load, which increases the difficulty of operating systems reliably. What happens is that, when a service is under high load, it will throttle. Throttling doesn't prevent requests from coming into the shard that's throttled, so when the shard wakes up from being throttled, it has even more work to do than it had before it throttled, causing it to use even more CPU and throttle more quickly, which causes even more work to pile up. Finagle has a mechanism that can shed load for shards that are in very bad shape (clients that talk to the dead server will mark the server as dead and stop sending request for a while) but, shards tend to get into this bad state when overall load to the service is high, so marking a node as dead just means that more load goes to other shards, which will then "want to" enter a throttling death spiral. Operating in a regime where throttling can cause a death spiral is an inherently metastable state. Removing both of these issues is arguably as large an impact as the cost reduction we see from eliminating throttling.
Xi Yang has experimented with variations on the naive kernel scheduler change mentioned above, but even the naive change seems to be quite effective compared to no change, even though the naive change does mean that services will often not be able to hit their full CPU allocation when they ask for it, e.g., if a service requests no CPU for the first half a period and then requests infinite CPU for the second half of the period, under the old system, it would get its allocated amount of CPU for the period, but under the new system, it would only get half. Some of Xi's variant patches address this issue in one way or another, but that has a relatively small impact compared to preventing throttling in the first place.
An independent change Pratik Tandel drove that reduced the impact of throttling on services by reducing the impact of variance between shards was to move to fewer larger shards. The main goal for that change was to reduce overhead due to duplicate work/memory that happens across all shards, but it also happens to have an impact due to larger per-shard quotas reducing the impact of random noise. Overall, this resulted in 0% to 20% reduced CPU usage and 10% to 40% reduced memory usage of large services at Twitter, depending on the service.
Thanks to Xi Yang, Ilya Pronin, Ian Downes, Rebecca Isaacs, Brian Martin, Vladimir Kotsyukov, Moses Nakamura, Flavio Brasil, Laurence Tratt, Akshay Shah, Julian Squires, Michael Greenberg @synrotek, and Miguel Angel Corral for comments/corrections/discussion