Once upon a time, my computer architecture professor mentioned that using a random eviction policy for caches really isn't so bad. That random eviction isn't bad can be surprising — if your cache fills up and you have to get rid of something, choosing the least recently used (LRU) is an obvious choice, since you're more likely to use something if you've used it recently. If you have a tight loop, LRU is going to be perfect as long as the loop fits in cache, but it's going to cause a miss every time if the loop doesn't fit. A random eviction policy degrades gracefully as the loop gets too big.
In practice, on real workloads, random tends to do worse than other algorithms. But what if we take two random choices (2-random) and just use LRU between those two choices?
Here are the relative miss rates we get for SPEC CPU with a Sandy Bridge-like cache (8-way associative, 64k, 256k, and 2MB L1, L2, and L3 caches, respectively). These are ratios (algorithm miss rate : random miss rate); lower is better. Each cache uses the same policy at all levels of the cache.
| Policy | L1 (64k) | L2 (256k) | L3 (2MB) |
| 2-random | 0.91 | 0.93 | 0.95 |
| FIFO | 0.96 | 0.97 | 1.02 |
| LRU | 0.90 | 0.90 | 0.97 |
| random | 1.00 | 1.00 | 1.00 |
Random and FIFO are both strictly worse than either LRU or 2-random. LRU and 2-random are pretty close, with LRU edging out 2-random for the smaller caches and 2-random edging out LRU for the larger caches.
To see if anything odd is going on in any individual benchmark, we can look at the raw results on each sub-benchmark. The L1, L2, and L3 miss rates are all plotted in the same column for each benchmark, below:
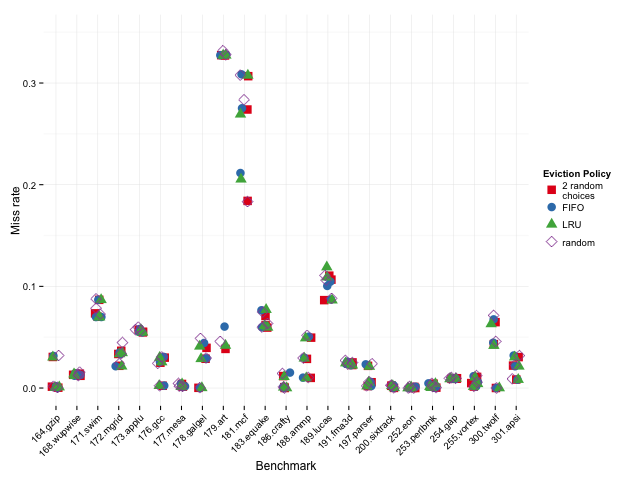
As we might expect, LRU does worse than 2-random when the miss rates are high, and better when the miss rates are low.
At this point, it's not clear if 2-random is beating LRU in L3 cache miss rates because it does better when the caches are large or because it does better because it's the third level in a hierarchical cache. Since a cache line that's being actively used in L1 or L2 isn't touched in L3, an eviction can happen from the L3 (which forces an eviction of both the L1 and L2) since, as far as the L3 is concerned, that line hasn't been used recently. This makes it less obvious that LRU is a good eviction policy for L3 cache.
To separate out the effects, let's look at the relative miss rates for a non-hierarchical (single level) vs. hierarchical caches at various sizes. For the hierarchical cache, the L1 and L2 sizes are as above, 64k and 256k, and only the L3 cache size varies. Below, we've got the geometric means of the ratios of how each policy does (over all SPEC sub-benchmarks, compared to random eviction). A possible downside to this metric is that if we have some very low miss rates, those could dominate the mean since small fluctuations will have a large effect on the ratio, but we can look the distribution of results to see if that's the case.
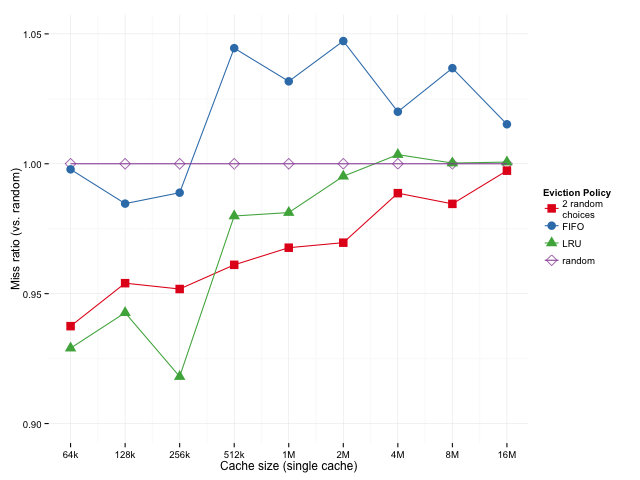
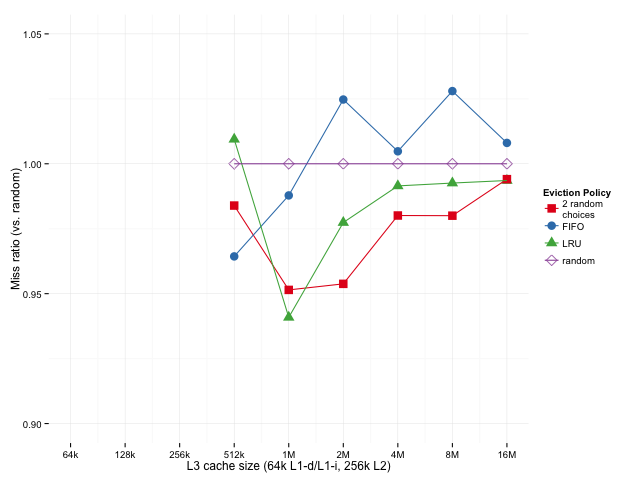
Sizes below 512k are missing for the hierarchical case because of the 256k L2 — we're using an inclusive L3 cache here, so it doesn't really make sense to have an L3 that's smaller than the L2. Sizes above 16M are omitted because cache miss rates converge when the cache gets too big, which is uninteresting.
Looking at the single cache case, it seems that LRU works a bit better than 2-random for smaller caches (lower miss ratio is better), 2-random edges out LRU as the cache gets bigger. The story is similar in the hierarchical case, except that we don't really look at the smaller cache sizes where LRU is superior.
Comparing the two cases, the results are different, but similar enough that it looks our original results weren't only an artifact of looking at the last level of a hierarchical cache.
Below, we'll look at the entire distribution so we can see if the mean of the ratios is being skewed by tiny results.
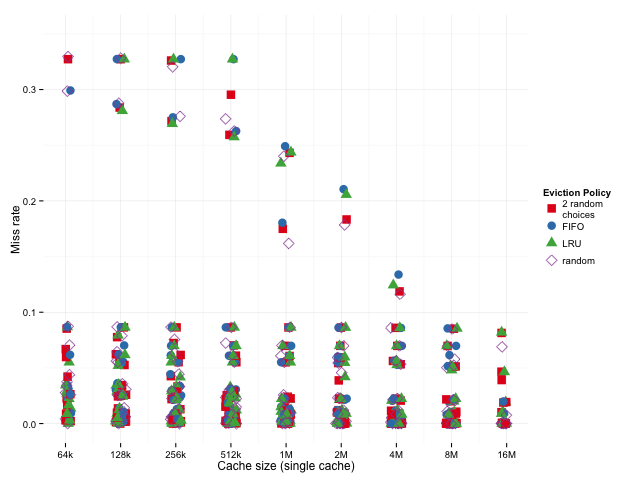
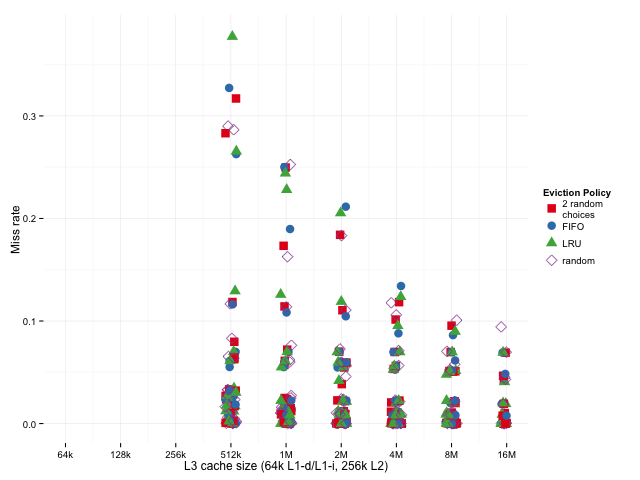
It looks like, for a particular cache size (one column of the graph), the randomized algorithms do better when miss rates are relatively high and worse when miss rates are relatively low, so, if anything, they're disadvantaged when we just look at the geometric mean — if we were to take the arithmetic mean, the result would be dominated by the larger results, where 2 random choices and plain old random do relatively well.
From what we've seen of the mean ratios, 2-random looks fine for large caches, and from what we've seen of the distribution of the results, that's despite 2-random being penalized by the mean ratio metric, which makes it seem pretty good for large caches.
However, it's common to implement pseudo-LRU policies because LRU can be too expensive to be workable. Since 2-random requires having at least as much information as LRU, let's take a look at what happens we use pseudo 2-random (approximately 80% accurate), and pseudo 3-random (a two-level tournament, each level of which is approximately 80% accurate).
Since random and FIFO are clearly not good replacement policies, I'll leave them out of the following graphs. Also, since the results were similar in the single cache as well as multi-level cache case, we can just look at the results from the more realistic multi-level cache case.
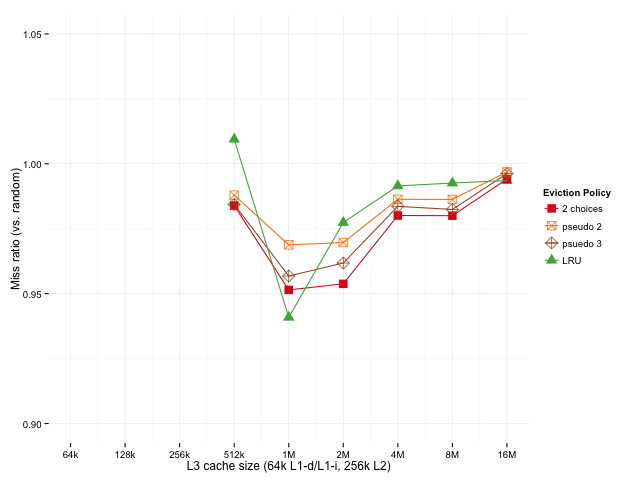
Since pseudo 2-random acts like random 20% of the time and 2-random 80% of the time, we might expect it to fall somewhere between 2-random and random, which is exactly what happens. A simple tweak to try to improve pseudo 2-random is to try pseudo 3-random (evict the least recently used of 3 random choices). While that's still not quite as good as true 2-random, it's pretty close, and it's still better than LRU (and pseudo LRU) for caches larger than 1M.
The one big variable we haven't explored is the set associativity. To see how LRU compares with 2-random across different cache sizes let's look at the LRU:2-random miss ratio (higher/red means LRU is better, lower/green means 2-random is better).
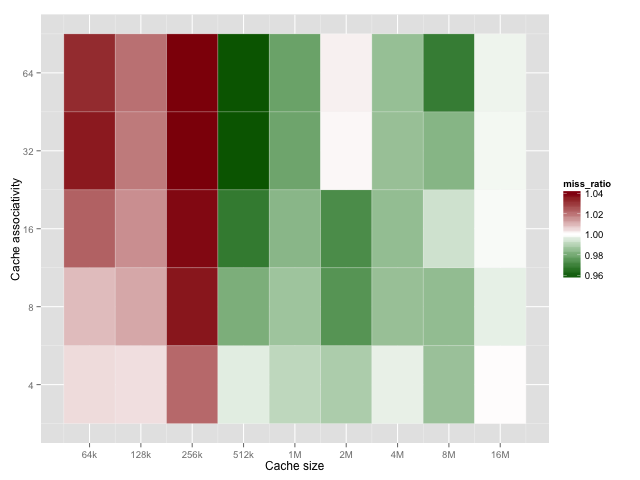
On average, increasing associativity increases the difference between the two policies. As before, LRU is better for small caches and 2-random is better for large caches. Associativities of 1 and 2 aren't shown because they should be identical for both algorithms.
There's still a combinatorial explosion of possibilities we haven't tried yet. One thing to do is to try different eviction policies at different cache levels (LRU for L1 and L2 with 2-random for L3 seems promising). Another thing to do is to try this for different types of caches. I happened to choose CPU caches because it's easy to find simulators and benchmark traces, but in today's “put a cache on it” world, there are a lot of other places 2-random can be applied.
For any comp arch folks, from this data, I suspect that 2-random doesn't keep up with adaptive policies like DIP (although it might — it's in the right ballpark, but it was characterized on a different workload using a different simulator, so it's not 100% clear). However, A pseudo 2-random policy can be implemented that barely uses more resources than pseudo-LRU policies, which makes this very cheap compared to DIP. Also, we can see that pseudo 3-random is substantially better than pseudo 2-random, which indicates that k-random is probably an improvement over 2-random for the k. Some k-random policy might be an improvement over DIP.
So we've seen that this works, but why would anyone think to do this in the first place? The Power of Two Random Choices: A Survey of Techniques and Results by Mitzenmacher, Richa, and Sitaraman has a great explanation. The mathematical intuition is that if we (randomly) throw n balls into n bins, the maximum number of balls in any bin is O(log n / log log n) with high probability, which is pretty much just O(log n). But if (instead of choosing randomly) we choose the least loaded of k random bins, the maximum is O(log log n / log k) with high probability, i.e., even with two random choices, it's basically O(log log n) and each additional choice only reduces the load by a constant factor.
This turns out to have all sorts of applications; things like load balancing and hash distribution are natural fits for the balls and bins model. There are also a lot of applications that aren't obviously analogous to the balls and bins model, like circuit routing and Erdős–Rényi graphs.
Thanks to Jan Elder and Mark Hill for making dinero IV freely available, to Aleksandar Milenkovic for providing SPEC CPU traces, and to Carl Vogel, James Porter, Peter Fraenkel, Katerina Barone-Adesi, Jesse Luehrs, Lea Albaugh, and Kevin Lynagh for advice on plots and plotting packages, to Mindy Preston for finding a typo in the acknowledgments, to Lindsey Kuper for pointing out some terminology stuff, to Tom Wenisch for suggesting that I check out CMP$im for future work, and to Leah Hanson for extensive comments on the entire post.