Perf is probably the most widely used general purpose performance debugging tool on Linux. There are multiple contenders for the #2 spot, and, like perf, they're sampling profilers. Sampling profilers are great. They tend to be easy-to-use and low-overhead compared to most alternatives. However, there are large classes of performance problems sampling profilers can't debug effectively, and those problems are becoming more important.
For example, consider a Google search query. Below, we have a diagram of how a query is carried out. Each of the black boxes is a rack of machines and each line shows a remote procedure call (RPC) from one machine to another.
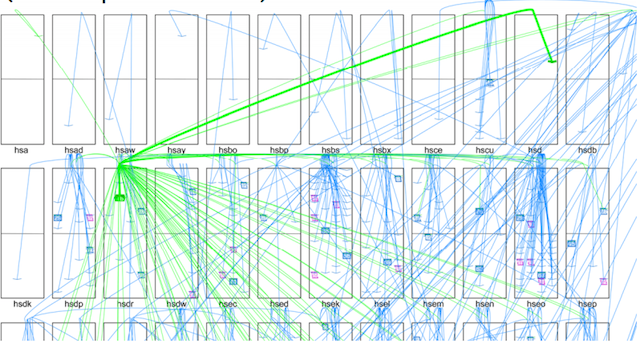
The diagram shows a single search query coming in, which issues RPCs to over a hundred machines (shown in green), each of which delivers another set of requests to the next, lower level (shown in blue). Each request at that lower level also issues a set of RPCs, which aren't shown because there's too much going on to effectively visualize. At that last leaf level, the machines do 1ms-2ms of work, and respond with the result, which gets propagated and merged on the way back, until the search result is assembled. While that's happening, on any leaf machine, 20-100 other search queries will touch the same machine. A single query might touch a couple thousand machines to get its results. If we look at the latency distribution for RPCs, we'd expect that with that many RPCs, any particular query will see a 99%-ile worst case (tail) latency; and much worse than mere 99%-ile, actually.
That latency translates directly into money. It's now well established that adding user latency reduces ad clicks, reduces the odds that a user will complete a transaction and buy something, reduces the odds that a user will come back later and become a repeat customer, etc. Over the past ten to fifteen years, the understanding that tail latency is an important factor in determining user latency, and that user latency translates directly to money, has trickled out from large companies like Google into the general consciousness. But debugging tools haven't kept up.
Sampling profilers, the most common performance debugging tool, are notoriously bad at debugging problems caused by tail latency because they aggregate events into averages. But tail latency is, by definition, not average.
For more on this, let's look at this wide ranging Dick Sites talk which covers, among other things, the performance tracing framework that Dick and others have created at Google. By capturing “every” event that happens, it lets us easily debug performance oddities that would otherwise be difficult to track down. We'll take a look at three different bugs to get an idea about the kinds of problems Google's tracing framework is useful for.
First, we can look at another view of the search query we just saw above: given a top-level query that issues some number of RPCs, how long does it take to get responses?
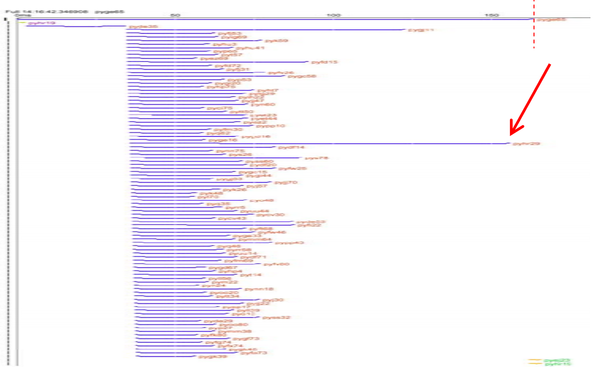
Time goes from left to right. Each row is one RPC, with the blue bar showing when the RPC was issued and when it finished. We can see that the first RPC is issued and returns before 93 other RPCs go out. When the last of those 93 RPCs is done, the search result is returned. We can see that two of the RPCs take substantially longer than the rest; the slowest RPC gates the result of the search query.
To debug this problem, we want a couple things. Because the vast majority of RPCs in a slow query are normal, and only a couple are slow, we need something that does more than just show aggregates, like a sampling profiler would. We need something that will show us specifically what's going on in the slow RPCs. Furthermore, because weird performance events may be hard to reproduce, we want something that's cheap enough that we can run it all the time, allowing us to look at any particular case of bad performance in retrospect. In the talk, Dick Sites mentions having a budget of about 1% of CPU for the tracing framework they have.
In addition, we want a tool that has time-granularity that's much shorter than the granularity of the thing we're debugging. Sampling profilers typically run at something like 1 kHz (1 ms between samples), which gives little insight into what happens in a one-time event, like an slow RPC that still executes in under 1ms. There are tools that will display what looks like a trace from the output of a sampling profiler, but the resolution is so poor that these tools provide no insight into most performance problems. While it's possible to crank up the sampling rate on something like perf, you can't get as much resolution as we need for the problems we're going to look at.
Getting back to the framework, to debug something like this, we might want to look at a much more zoomed in view. Here's an example with not much going on (just tcpdump and some packet processing with recvmsg), just to illustrate what we can see when we zoom in.
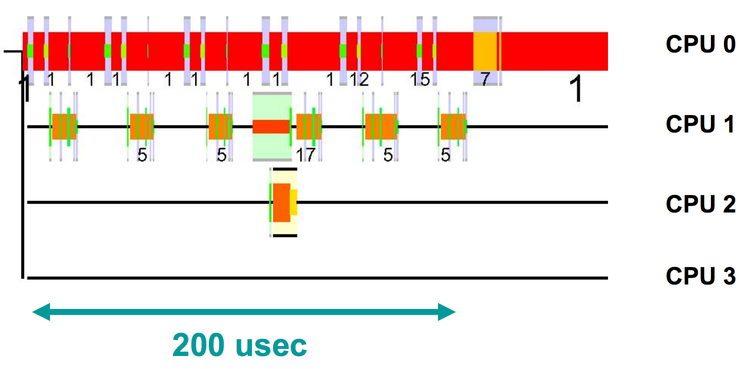
The horizontal axis is time, and each row shows what a CPU is executing. The different colors indicate that different things are running. The really tall slices are kernel mode execution, the thin black line is the idle process, and the medium height slices are user mode execution. We can see that CPU0 is mostly handling incoming network traffic in a user mode process, with 18 switches into kernel mode. CPU1 is maybe half idle, with a lot of jumps into kernel mode, doing interrupt processing for tcpdump. CPU2 is almost totally idle, except for a brief chunk when a timer interrupt fires.
What's happening is that every time a packet comes in, an interrupt is triggered to notify tcpdump about the packet. The packet is then delivered to the process that called recvmsg on CPU0. Note that running tcpdump isn't cheap, and it actually consumes 7% of a server if you turn it on when the server is running at full load. This only dumps network traffic, and it's already at 7x the budget we have for tracing everything! If we were to look at this in detail, we'd see that Linux's TCP/IP stack has a large instruction footprint, and workloads like tcpdump will consistently come in and wipe that out of the l1i and l2 caches.
Anyway, now that we've seen a simple example of what it looks like when we zoom in on a trace, let's look at how we can debug the slow RPC we were looking at before.
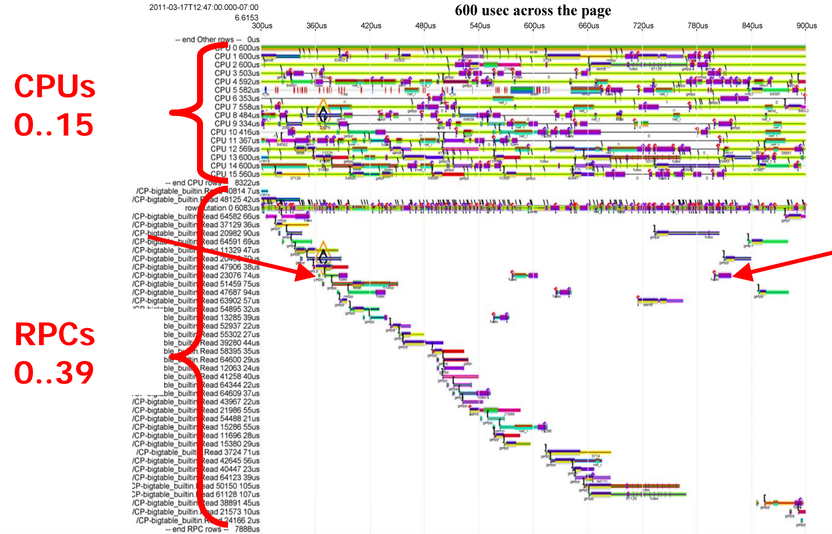
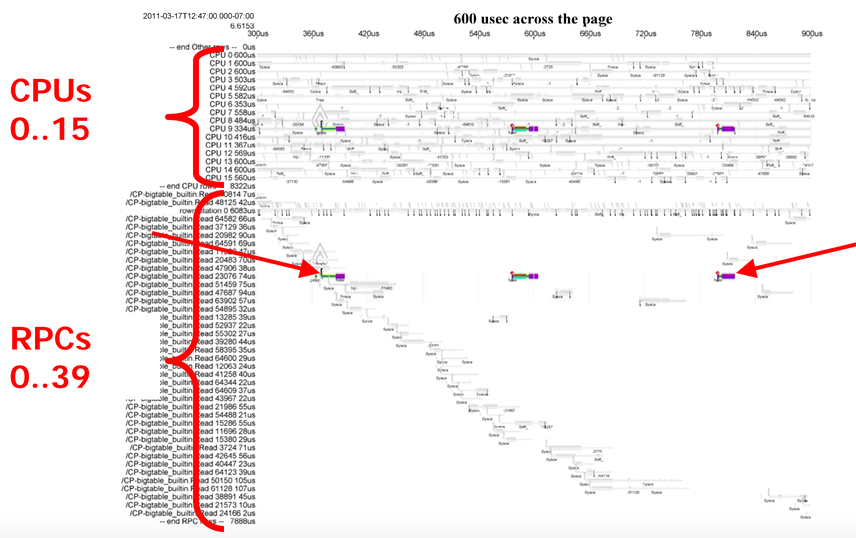
We have two views of a trace of one machine here. At the top, there's one row per CPU, and at the bottom there's one row per RPC. Looking at the top set, we can see that there are some bits where individual CPUs are idle, but that the CPUs are mostly quite busy. Looking at the bottom set, we can see parts of 40 different searches, most of which take around 50us, with the exception of a few that take much longer, like the one pinned between the red arrows.
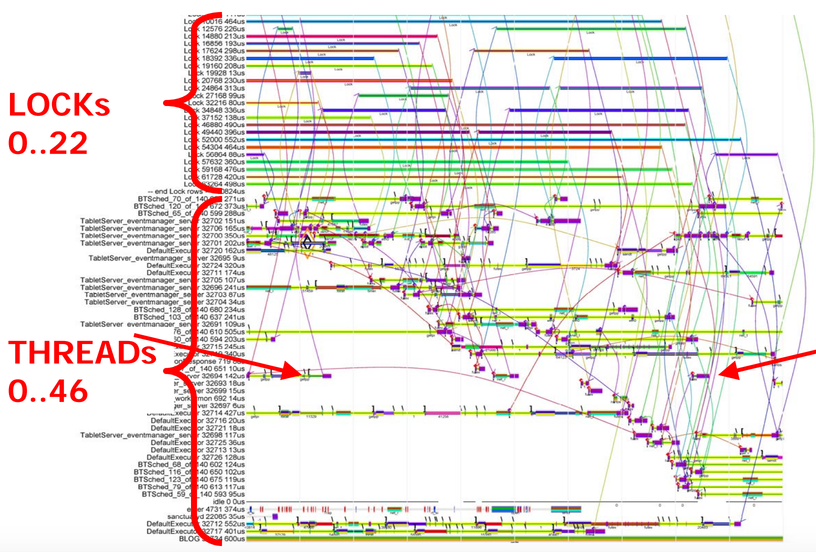
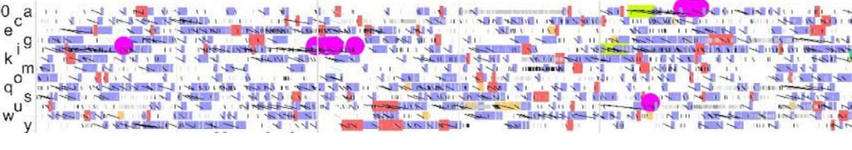
We can also look at a trace of the same timeframe by which locks are behind held and which threads are executing. The arcs between the threads and the locks show when a particular thread is blocked, waiting on a particular lock. If we look at this, we can see that the time spent waiting for locks is sometimes much longer than the time spent actually executing anything. The thread pinned between the arrows is the same thread that's executing that slow RPC. It's a little hard to see what's going on here, so let's focus on that single slow RPC.
We can see that this RPC spends very little time executing and a lot of time waiting. We can also see that we'd have a pretty hard time trying to find the cause of the waiting with traditional performance measurement tools. According to stackoverflow, you should use a sampling profiler! But tools like OProfile are useless since they'll only tell us what's going on when our RPC is actively executing. What we really care about is what our thread is blocked on and why.
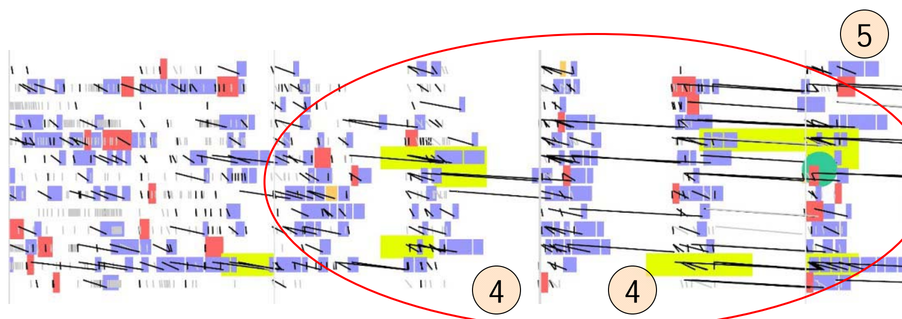
Instead of following the advice from stackoverflow, let's look at the second view of this again.
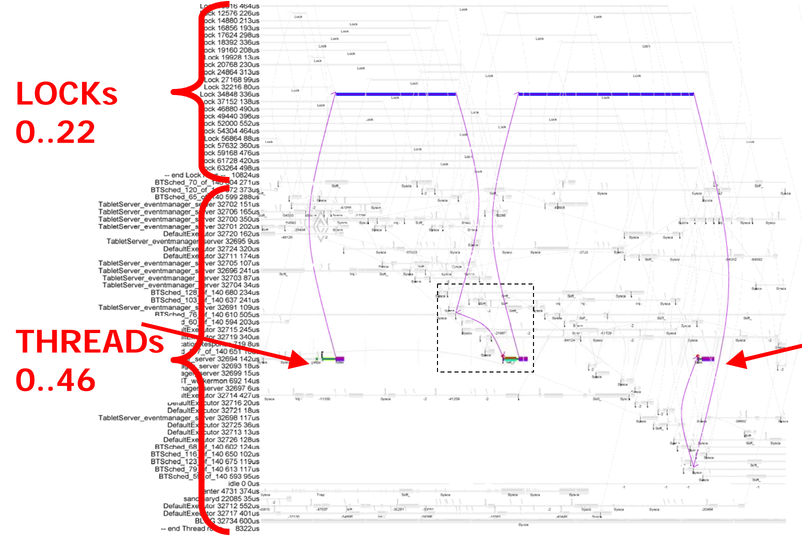
We can see that, not only is this RPC spending most of its time waiting for locks, it's actually spending most of its time waiting for the same lock, with only a short chunk of execution time between the waiting. With this, we can look at the cause of the long wait for a lock. Additionally, if we zoom in on the period between waiting for the two locks, we can see something curious.
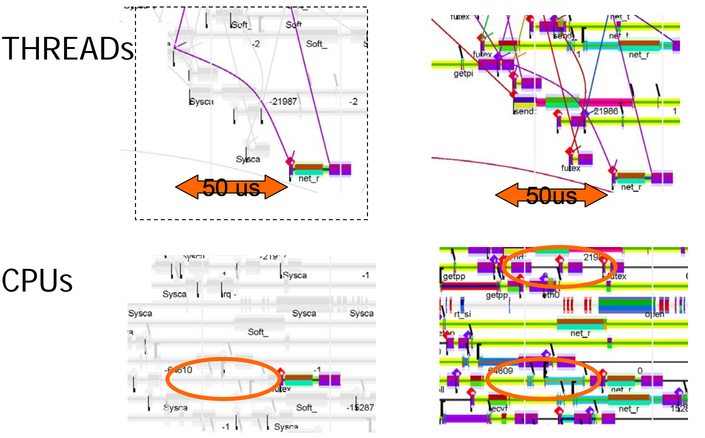
It takes 50us for the thread to start executing after it gets scheduled. Note that the wait time is substantially longer than the execution time. The waiting is because an affinity policy was set which will cause the scheduler to try to schedule the thread back to the same core so that any data that's in the core's cache will still be there, giving you the best possible cache locality, which means that the thread will have to wait until the previously scheduled thread finishes. That makes intuitive sense, but if consider, for example, a 2.2GHz Skylake, the cache latency is 6.4ns, and 21.2ns to l2, and l3 cache, respectively. Is it worth changing the affinity policy to speed this kind of thing up? You can't tell from this single trace, but with the tracing framework used to generate this data, you could do the math to figure out if you should change the policy.
In the talk, Dick notes that, given the actual working set size, it would be worth waiting up to 10us to schedule on another CPU sharing the same l2 cache, and 100us to schedule on another CPU sharing the same l3 cache.
Something else you can observe from this trace is that, if you care about a workload that resembles Google search, basically every standard benchmark out there is bad, and the standard technique of running N copies of spec is terrible. That's not a straw man. People still do that in academic papers today, and some chip companies use SPEC to benchmark their mobile devices!
Anyway, that was one performance issue where we were able to see what was going on because of the ability to see a number of different things at the same time (CPU scheduling, thread scheduling, and locks). Let's look at a simpler single-threaded example on a single machine where a tracing framework is still beneficial:
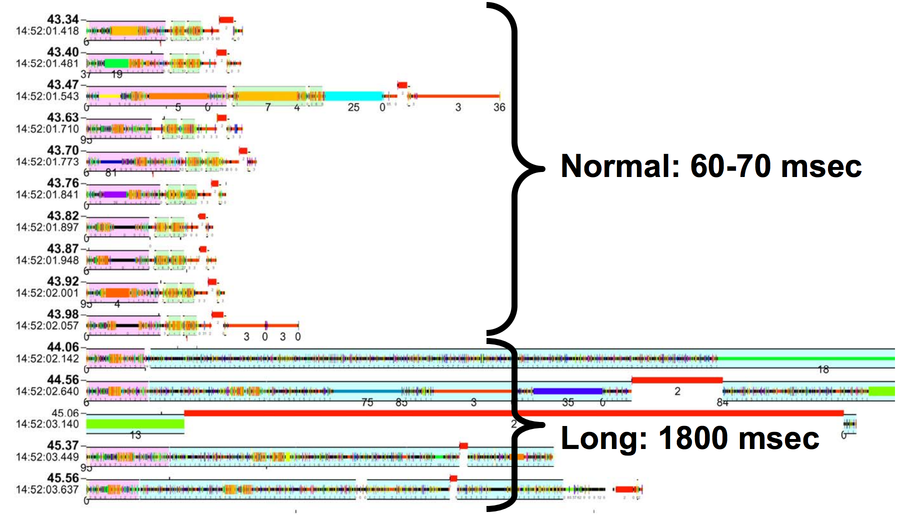
This is a trace from gmail, circa 2004. Each row shows the processing that it takes to handle one email. Well, except for the last 5 rows; the last email shown takes so long to process that displaying all of the processing takes 5 rows of space. If we look at each of the normal emails, they all look approximately the same in terms of what colors (i.e., what functions) are called and how much time they take. The last one is different. It starts the same as all the others, but then all this other junk appears that only happens in the slow email.
The email itself isn't the problem -- all of that extra junk is the processing that's done to reindex the words from the emails that had just come in, which was batched up across multiple emails. This picture caused the Gmail devs to move that batch work to another thread, reducing tail latency from 1800ms to 100ms. This is another performance bug that it would be very difficult to track down with standard profiling tools. I've often wondered why email almost always appears quickly when I send to gmail from gmail, and it sometimes takes minutes when I send work email from outlook to outlook. My guess is that a major cause is that it's much harder for the outlook devs to track down tail latency bugs like this than it is for the gmail devs to do the same thing.
Let's look at one last performance bug before moving on to discussing what kind of visibility we need to track these down. This is a bit of a spoiler, but with this bug, it's going to be critical to see what the entire machine is doing at any given time.
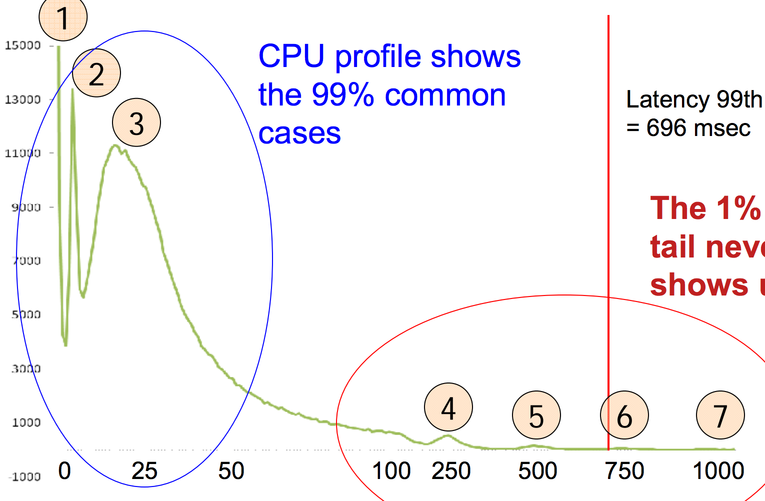
This is a histogram of disk latencies on storage machines for a 64kB read, in ms. There are two sets of peaks in this graph. The ones that make sense, on the left in blue, and the ones that don't, on the right in red.
Going from left to right on the peaks that make sense, first there's the peak at 0ms for things that are cached in RAM. Next, there's a peak at 3ms. That's way too fast for the 7200rpm disks we have to transfer 64kB; the time to get a random point under the head is already (1/(7200/60)) / 2 s = 4ms. That must be the time it takes to transfer something from the disk's cache over PCIe. The next peak, at near 25ms, is the time it takes to seek to a point and then read 64kB off the disk.
Those numbers don't look so bad, but the 99%-ile latency is a whopping 696ms, and there are peaks at 250ms, 500ms, 750ms, 1000ms, etc. And these are all unreproducible -- if you go back and read a slow block again, or even replay the same sequence of reads, the slow reads are (usually) fast. That's weird! What could possibly cause delays that long? In the talk, Dick Sites says “each of you think of a guess, and you'll find you're all wrong”.
That's a trace of thirteen disks in a machine. The blue blocks are reads, and the red blocks are writes. The black lines show the time from the initiation of a transaction by the CPU until the transaction is completed. There are some black lines without blocks because some of the transactions hit in a cache and don't require actual disk activity. If we wait for a period where we can see tail latency and zoom in a bit, we'll see this:
We can see that there's a period where things are normal, and then some kind of phase transition into a period where there are 250ms gaps (4) between periods of disk activity (5) on the machine for all disks. This goes on for nine minutes. And then there's a phase transition and disk latencies go back to normal. That it's machine wide and not disk specific is a huge clue.
Using that information, Dick pinged various folks about what could possibly cause periodic delays that are a multiple of 250ms on an entire machine, and found out that the cause was kernel throttling of the CPU for processes that went beyond their usage quota. To enforce the quota, the kernel puts all of the relevant threads to sleep until the next multiple of a quarter second. When the quarter-second hand of the clock rolls around, it wakes up all the threads, and if those threads are still using too much CPU, the threads get put back to sleep for another quarter second. The phase change out of this mode happens when, by happenstance, there aren't too many requests in a quarter second interval and the kernel stops throttling the threads.
After finding the cause, an engineer found that this was happening on 25% of disk servers at Google, for an average of half an hour a day, with periods of high latency as long as 23 hours. This had been happening for three years. Dick Sites says that fixing this bug paid for his salary for a decade. This is another bug where traditional sampling profilers would have had a hard time. The key insight was that the slowdowns were correlated and machine wide, which isn't something you can see in a profile.
One question you might have is, is this because of some flaw in existing profilers, or can profilers provide enough information that you don't need to use tracing tools to track down rare, long-tail, performance bugs? I've been talking to Xi Yang about this, who had an ISCA 2015 paper and talk describing some of his work. He and his collaborators have done a lot more since publishing the paper, but the paper still contains great information on how far a profiling tool can be pushed. As Xi explains in his talk, one of the fundamental limits of a sampling profiler is how often you can sample.
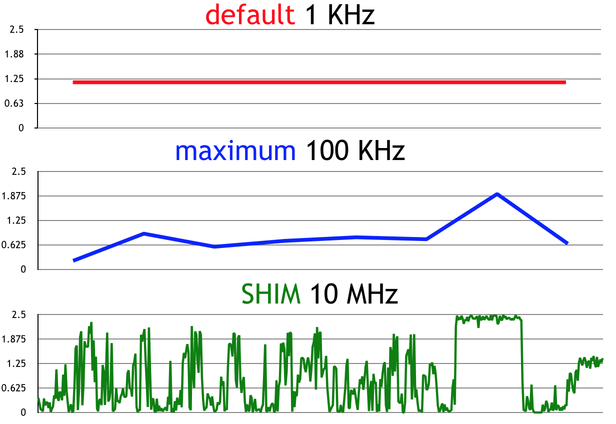
This is a graph of the number of the number of executed instructions per clock (IPC) over time in Lucene, which is the core of Elasticsearch.
At 1kHz, which is the default sampling interval for perf, you basically can't see that anything changes over time at all. At 100kHz, which is as fast as perf runs, you can tell something is going on, but not what. The 10MHz graph is labeled SHIM because that's the name of the tool presented in the paper. At 10MHz, you get a much better picture of what's going on (although it's worth noting that 10MHz is substantially lower resolution than you can get out of some tracing frameworks).
If we look at the IPC in different methods, we can see that we're losing a lot of information at the slower sampling rates:
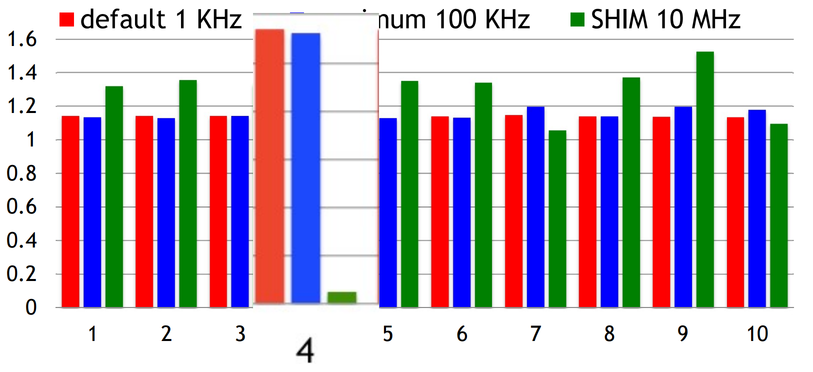
This is the top 10 hottest methods Lucene ranked by execution time; these 10 methods account for 74% of the total execution time. With perf, it's hard to tell which methods have low IPC, i.e., which methods are spending time stalled. But with SHIM, we can clearly see that there's one method that spends a lot of time waiting, #4.
In retrospect, there's nothing surprising about these graphs. We know from the Nyquist theorem that, to observe a signal with some frequency, X, we have to sample with a rate at least 2X. There are a lot of factors of performance that have a frequency higher than 1kHz (e.g., CPU p-state changes), so we should expect that we're unable to directly observe a lot of things that affect performance with perf or other traditional sampling profilers. If we care about microbenchmarks, we can get around this by repeatedly sampling the same thing over and over again, but for rare or one-off events, it may be hard or impossible to do that.
This raises a few questions:
- Why does perf sample so infrequently?
- How does SHIM get around the limitations of perf?
- Why are sampling profilers dominant?
1. Why does perf sample so infrequently?
This comment from events/core.c in the linux kernel explains the limit:
perf samples are done in some very critical code paths (NMIs). If they get too much CPU time, the system can lock up and not get any real work done.
As we saw from the tcpdump trace in the Dick Sites talk, interrupts take a significant amount of time to get processed, which limits the rate at which you can sample with an interrupt based sampling mechanism.
2. How does SHIM get around the limitations of perf?
Instead of having an interrupt come in periodically, like perf, SHIM instruments the runtime so that it periodically runs a code snippet that can squirrel away relevant information. In particular, the authors instrumented the Jikes RVM, which injects yield points into every method prologue, method epilogue, and loop back edge. At a high level, injecting a code snippet into every function prologue and epilogue sounds similar to what Dick Sites describes in his talk.
The details are different, and I recommend both watching the Dick Sites talk and reading the Yang et al. paper if you're interested in performance measurement, but the fundamental similarity is that both of them decided that it's too expensive to having another thread break in and sample periodically, so they both ended up injecting some kind of tracing code into the normal execution stream.
It's worth noting that sampling, at any frequency, is going to miss waiting on (for example) software locks. Dick Sites's recommendation for this is to timestamp based on wall clock (not CPU clock), and then try to find the underlying causes of unusually long waits.
3. Why are sampling profilers dominant?
We've seen that Google's tracing framework allows us to debug performance problems that we'd never be able to catch with traditional sampling profilers, while also collecting the data that sampling profilers collect. From the outside, SHIM looks like a high-frequency sampling profiler, but it does so by acting like a tracing tool. Even perf is getting support for low-overhead tracing. Intel added hardware support for certain types for certain types of tracing in Broadwell and Skylake, along with kernel support in 4.1 (with user mode support for perf coming in 4.3). If you're wondering how much overhead these tools have, Andi Kleen claims that the Intel tracing support in Linux has about a 5% overhead, and Dick Sites mentions in the talk that they have a budget of about 1% overhead.
It's clear that state-of-the-art profilers are going to look a lot like tracing tools in the future, but if we look at the state of things today, the easiest options are all classical profilers. You can fire up a profiler like perf and it will tell you approximately how much time various methods are taking. With other basic tooling, you can tell what's consuming memory. Between those two numbers, you can solve the majority of performance issues. Building out something like Google's performance tracing framework is non-trivial, and cobbling together existing publicly available tools to trace performance problems is a rough experience. You can see one example of this when Marek Majkowski debugged a tail latency issue using System Tap.
In Brendan Gregg's page on Linux tracers, he says “[perf_events] can do many things, but if I had to recommend you learn just one [tool], it would be CPU profiling”. Tracing tools are cumbersome enough that his top recommendation on his page about tracing tools is to learn a profiling tool!
Now what?
If you want to use an tracing tool like the one we looked at today your options are:
- Get a job at Google
- Build it yourself
- Cobble together what you need out of existing tools
I hear Steve Yegge has good advice on how to do this. If you go this route, try to attend orientation in Mountain View. They have the best orientation.
2. Build it yourself
If you look at the SHIM paper, there's a lot of cleverness built-in to get really fine-grained information while minimizing overhead. I think their approach is really neat, but considering the current state of things, you can get a pretty substantial improvement without much cleverness. Fundamentally, all you really need is some way to inject your tracing code at the appropriate points, some number of bits for a timestamp, plus a handful of bits to store the event.
Say you want trace transitions between user mode and kernel mode. The transitions between waiting and running will tell you what the thread was waiting on (e.g., disk, timer, IPI, etc.). There are maybe 200k transitions per second per core on a busy node. 200k events with a 1% overhead is 50ns per event per core. A cache miss is well over 100 cycles, so our budget is less than one cache miss per event, meaning that each record must fit within a fraction of a cache line. If we have 20 bits of timestamp (RDTSC >> 8 bits, giving ~100ns resolution and 100ms range) and 12 bits of event, that's 4 bytes, or 16 events per cache line. Each core has to have its own buffer to avoid cache contention. To map RDTSC times back to wall clock times, calling gettimeofday along with RDTSC at least every 100ms is sufficient.
Now, say the machine is serving 2000 QPS. That's 20 99%-ile tail events per second and 2 99.9% tail events per second. Since those events are, by definition, unusually long, Dick Sites recommends a window of 30s to 120s to catch those events. If we have 4 bytes per event * 200k events per second * 40 cores, that's about 32MB/s of data. Writing to disk while we're logging is hopeless, so you'll want to store the entire log while tracing, which will be in the range of 1GB to 4GB. That's probably fine for a typical machine in a datacenter, which will have between 128GB and 256GB of RAM.
My not-so-secret secret hope for this post is that someone will take this idea and implement it. That's already happened with at least one blog post idea I've thrown out there, and this seems at least as valuable.
If you don't have a magical framework that solves all your problems, the tool you want is going to depend on the problem you're trying to solve.
For figuring out why things are waiting, Brendan Gregg's write-up on off-CPU flame graphs is a pretty good start if you don't have access to internal Google tools. For that matter, his entire site is great if you're doing any kind of Linux performance analysis. There's info on Dtrace, ftrace, SystemTap, etc. Most tools you might use are covered, although PMCTrack is missing.
The problem with all of these is that they're all much higher overhead than the things we've looked at today, so they can't be run in the background to catch and effectively replay any bug that comes along if you operate at scale. Yes, that includes dtrace, which I'm calling out in particular because any time you have one of these discussions, a dtrace troll will come along to say that dtrace has supported that for years. It's like the common lisp of trace tools, in terms of community trolling.
Anyway, if you're on Windows, Bruce Dawson's site seems to be the closest analogue to Bredan Gregg's site. If that doesn't have enough detail, there's always the Windows Internals books.
This is a bit far afield, but for problems where you want an easy way to get CPU performance counters, likwid is nice. It has a much nicer interface than perf stat, lets you easily only get stats for selected functions, etc.
Thanks to Nathan Kurz, Xi Yang, Leah Hanson, John Gossman, Dick Sites, Hari Angepat, and Dan Puttick for comments/corrections/discussion.
P.S. Xi Yang, one of the authors of SHIM is finishing up his PhD soon and is going to be looking for work. If you want to hire a performance wizard, he has a CV and resume here.